ChRIS PACS Bulk Query & Retrieve — End-to-End Pipeline Manual
ChRIS · chris.tch.harvard.edu
Overview
This manual walks through the complete end-to-end workflow for running a PACS bulk query against ChRIS, downloading the results, and then using those results to drive a bulk retrieve (anonymized DICOM and NIfTI download) pipeline. The workflow has two parts:
- Part A — Bulk Query: search the PACS for studies/series matching criteria in a CSV spec, using the
pl-dyanonplugin. - Part B — Bulk Retrieve: take the query results, fill in retrieval instructions, and pull the matching DICOM/NIfTI data using the
pl-dypxflowplugin.
Note: Part B depends on the output of Part A — the query results CSV becomes the input spec (after editing) for the retrieve step.
Prerequisites
- A valid single sign-on (LDAP) username and password for ChRIS.
- PACS access: your ChRIS account must belong to the
pacs_usersgroup. If you don't already have this, request it by emailing Newborn_FNNDSCdev-dl and asking to be added topacs_users— without this, PACS queries and retrievals will fail. - The CSV templates
bulk_query_spec.csv(for Part A) andbulk_retrieve_spec.csv(for Part B). - Recipient email address(es) to receive pipeline notifications.
Reference Endpoints & Compute Environment
| Setting | Value |
|---|---|
| CUBE URL | http://ekanite.tch.harvard.edu:32223/api/v1/ |
| PFDCM URL | http://chris.tch.harvard.edu:3224/api/v1/ |
| PACS name | PACSDCM |
| Compute environment | argentum |
Part A — Bulk Query
Use this workflow to search the PACS for studies matching a set of criteria (e.g. Patient ID and Study Date) and produce a results table.
Step 1. Log in to ChRIS
- Navigate to the ChRIS login page at chris.tch.harvard.edu.
- Enter your LDAP username and password, then click Log in.
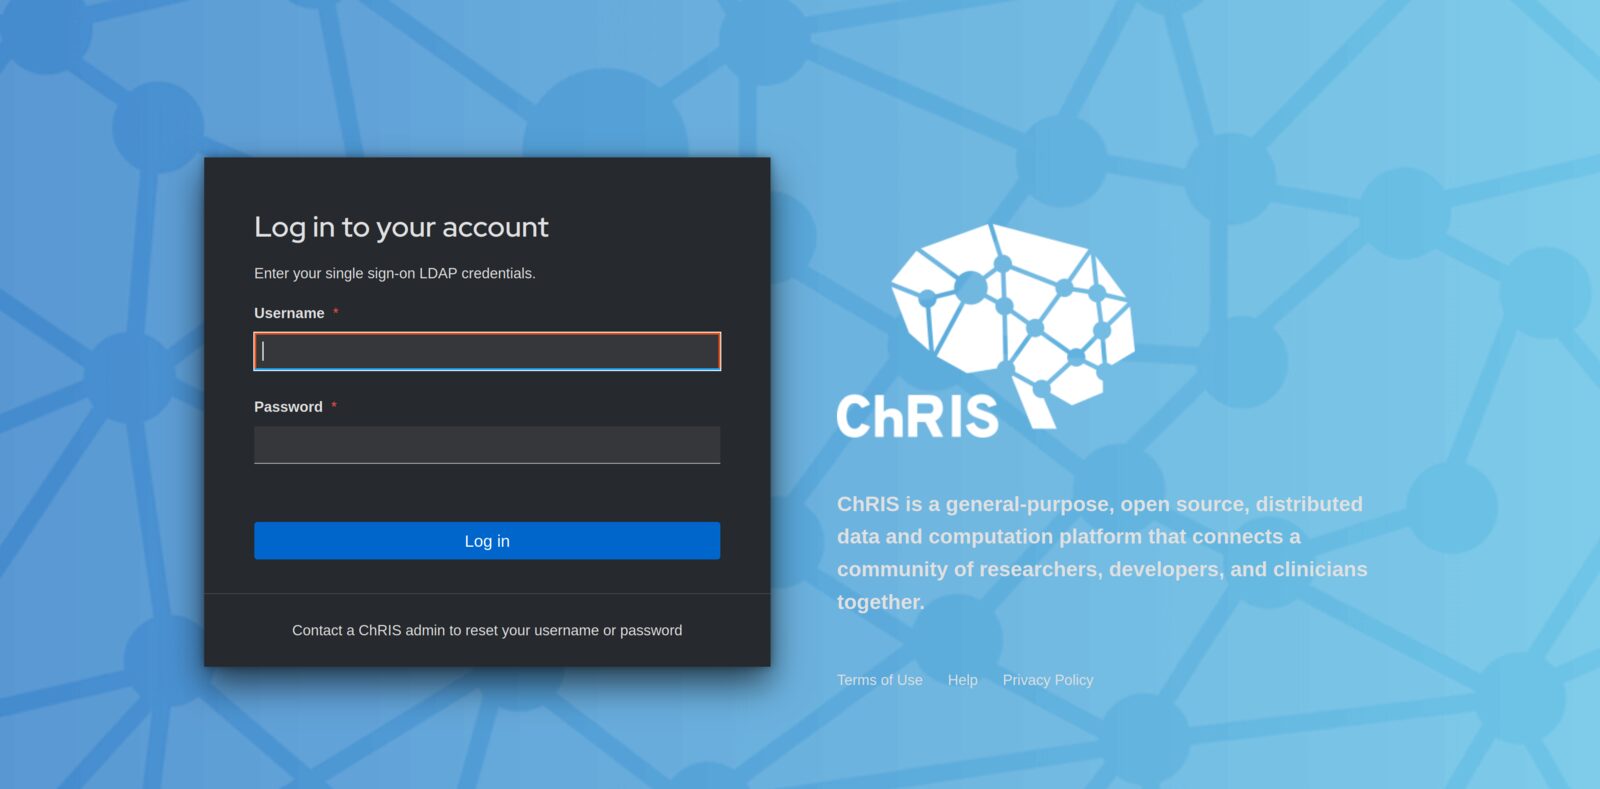
Figure A1 — ChRIS single sign-on login screen
Step 2. Open the Analyses list
- After logging in, you land on the Private Feeds view, which lists all analyses you have created, along with their creation date, creator, and status.
- Click Create Analysis in the top-right corner to start a new one.
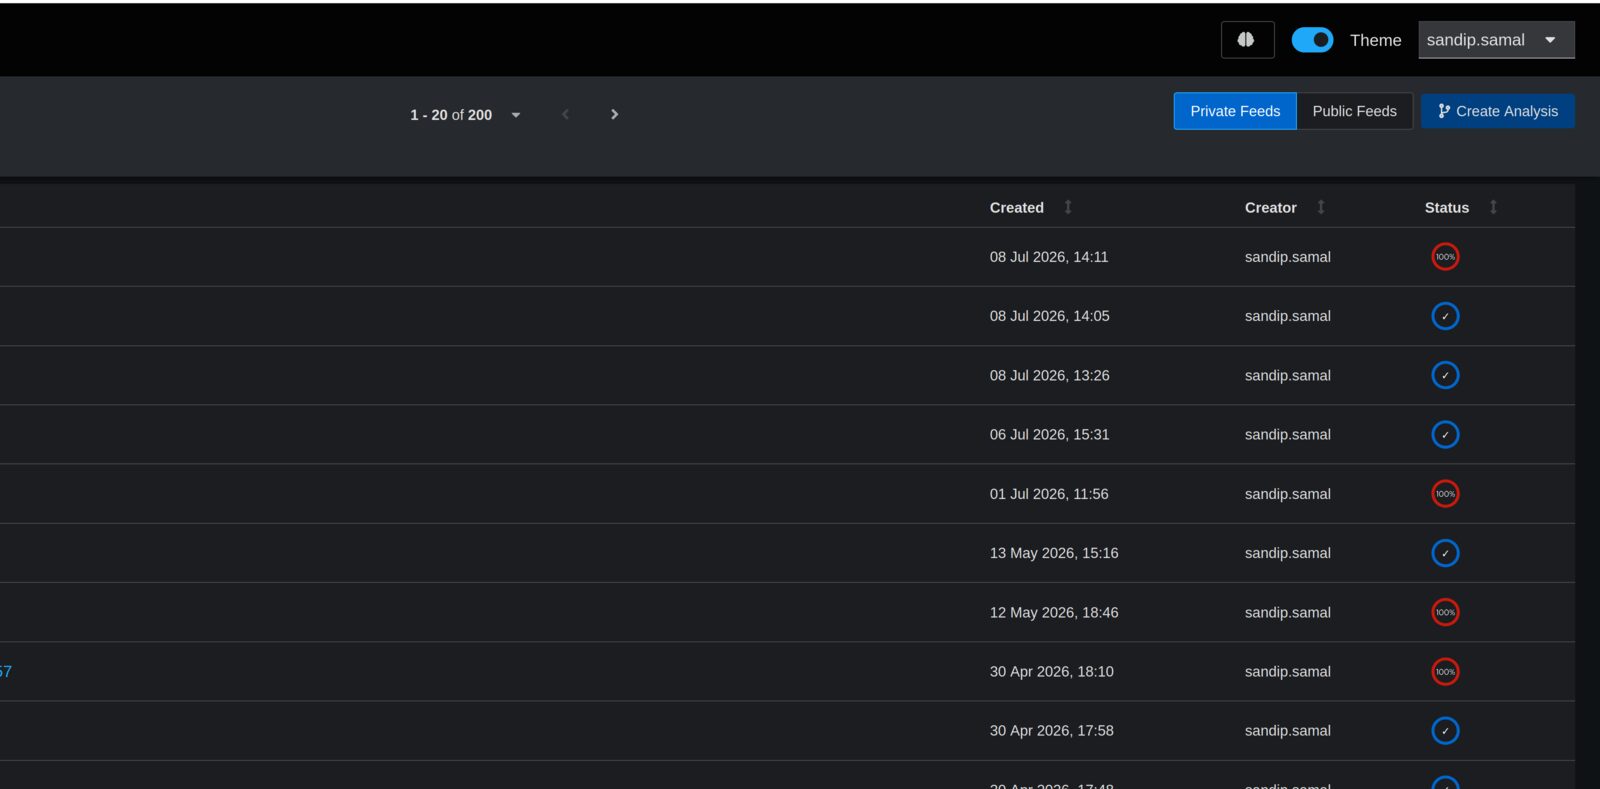
Figure A2 — Private Feeds list, showing prior analyses and the Create Analysis button
Step 3. Create a new analysis
- In the Create a New Analysis wizard, fill in the Analysis Name field (e.g. "bulk-query").
- Optionally add an Analysis Note describing the purpose of the run, and any Tags.
- Proceed to the next step of the wizard to select input data.
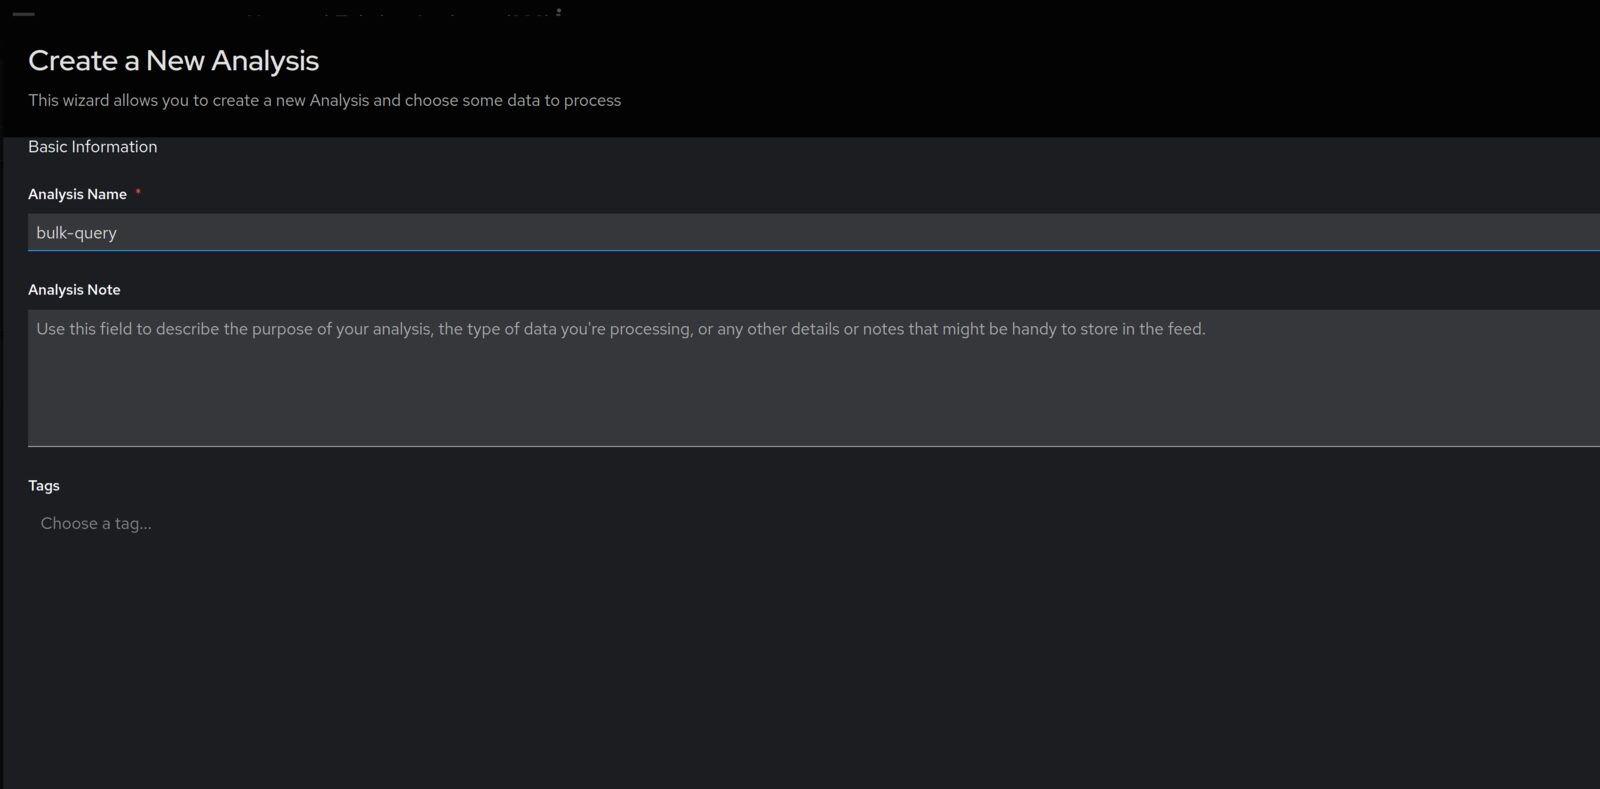
Figure A3 — Create a New Analysis: Basic Information form
Step 4. Upload the query CSV template
-
On the data-selection screen, choose Upload New Data (or Fetch Data from ChRIS if the file is already registered).
-
Upload the
bulk_query_spec.csvtemplate, filled in with the desiredSearch_PatientID,Search_StudyDate, and anySearch_<tagName>columns.Search_<tagName> columns:
tagNamecan be any DICOM header tag you want to filter on — the column header must be prefixed withSearch_. Common examples:Search_ModalitySearch_StudyDescriptionSearch_SeriesDescriptionSearch_PatientBirthDateSearch_StudyDateSearch_AccessionNumber
Date-type tags (e.g.
Search_StudyDate,Search_PatientBirthDate) must be entered in YYYYMMDD format.Regex-capable tags:
Search_StudyDescriptionandSearch_SeriesDescriptionsupport regex-style partial matching. Wrap the pattern in asterisks, e.g.*pattern*, to match any description containing that pattern. Other fields (IDs, dates, Modality, Accession Number) should be entered as exact values.Example 1 — match on Patient ID, Study Date, and Modality:
Search_PatientID Search_StudyDate Search_Modality 021345 19001010 MR Example 2 — match on Accession Number, Modality, and a partial Series Description:
Search_AccessionNumber Search_Modality Search_SeriesDescription 1544889565 MR *sag t1* Example 3 — match across multiple studies for the same patient by date and a partial Study Description (one row per study; leave a column blank to skip filtering on that tag for a given row):
Search_PatientID Search_StudyDate Search_Modality Search_StudyDescription 021345 20100304 CT *chest* 021345 20120917 CT *chest* -
Finish the wizard to create the analysis (feed).
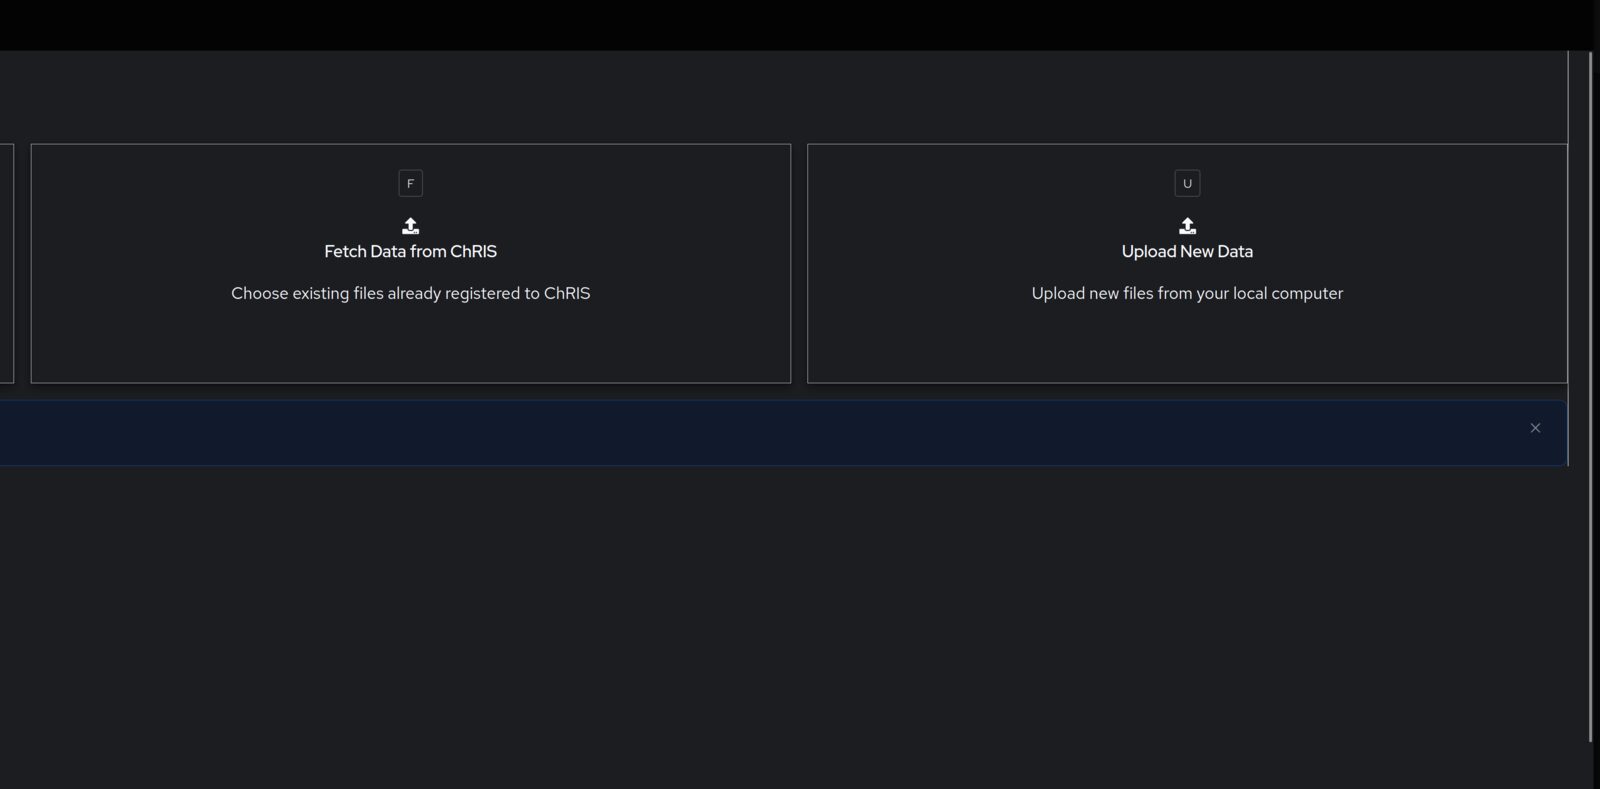
Figure A4 — Data selection: Fetch Data from ChRIS vs. Upload New Data
Step 5. Add the pl-dyanon child node
- Open the newly created analysis and locate the root node in the feed graph.
- Right-click the root node and choose + Add a Child Node.
- Search for and select the plugin pl-dyanon.
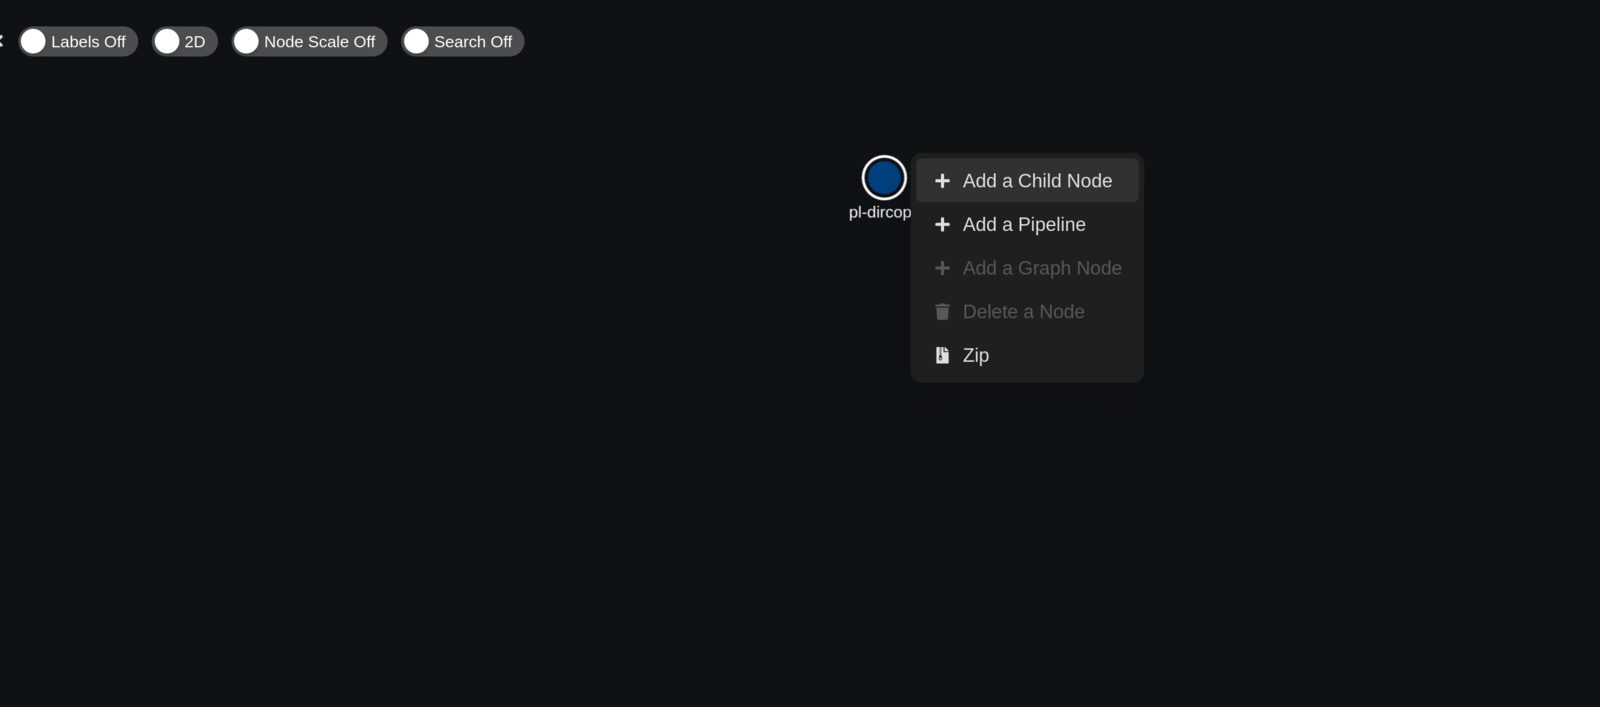
Figure A5 — Add a Child Node context menu on the root node
Note: This context menu also offers Add a Pipeline and Add a Graph Node, and lets you Zip or Delete a node. Use Add a Child Node for a single plugin step.
Step 6. Configure the pl-dyanon node
- In the Add a New Node wizard, select the desired Plugin Version and Compute environment (
argentum). - Check Fill the form using a latest run of this plugin to auto-populate the Command Line Parameters field.
- If parameters are not auto-filled, paste the following into Command Line Parameters:
--CUBEurl http://ekanite.tch.harvard.edu:32223/api/v1/ --PFDCMurl http://chris.tch.harvard.edu:3224/api/v1/
--PACSname PACSDCM --recipients example@abc.com
--pipelineName 'Bulk PACS query pipeline using CUBE 20260325'
--reducePipelineName 'Tablify PACS query results using CUBE 20260402'
- Click Validate to confirm the parameters resolve correctly, then click Add Node.
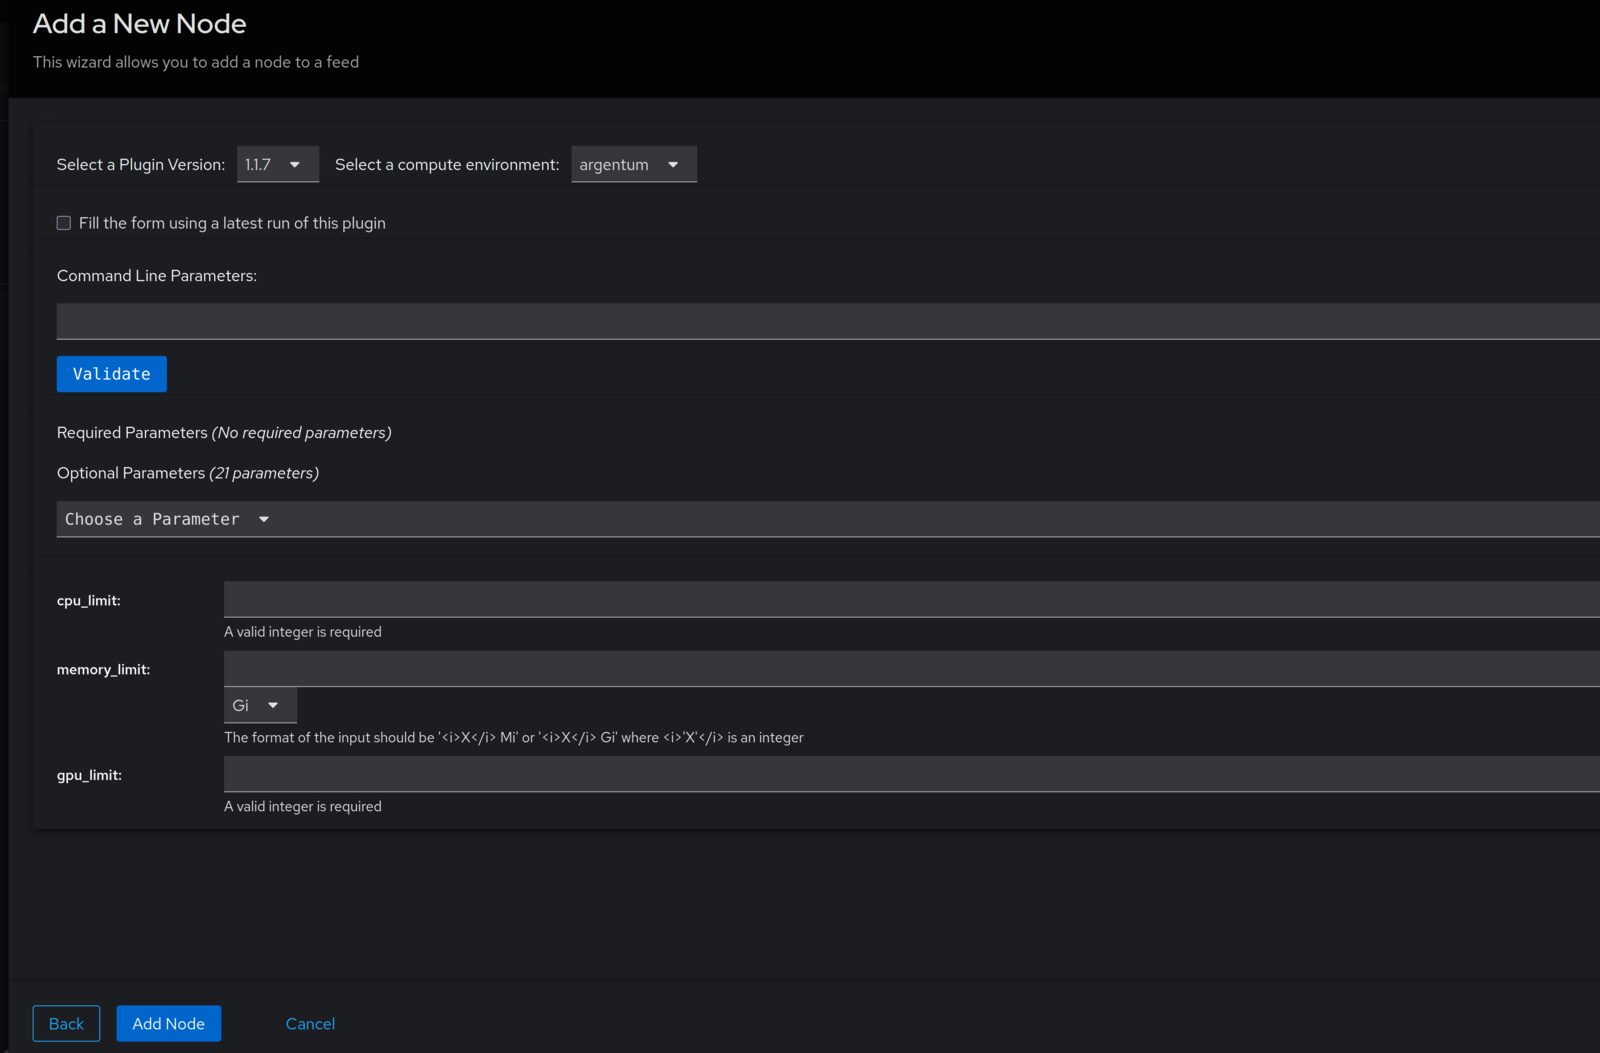
Figure A6 — Add a New Node wizard, empty parameter form with cpu/memory/gpu limit fields
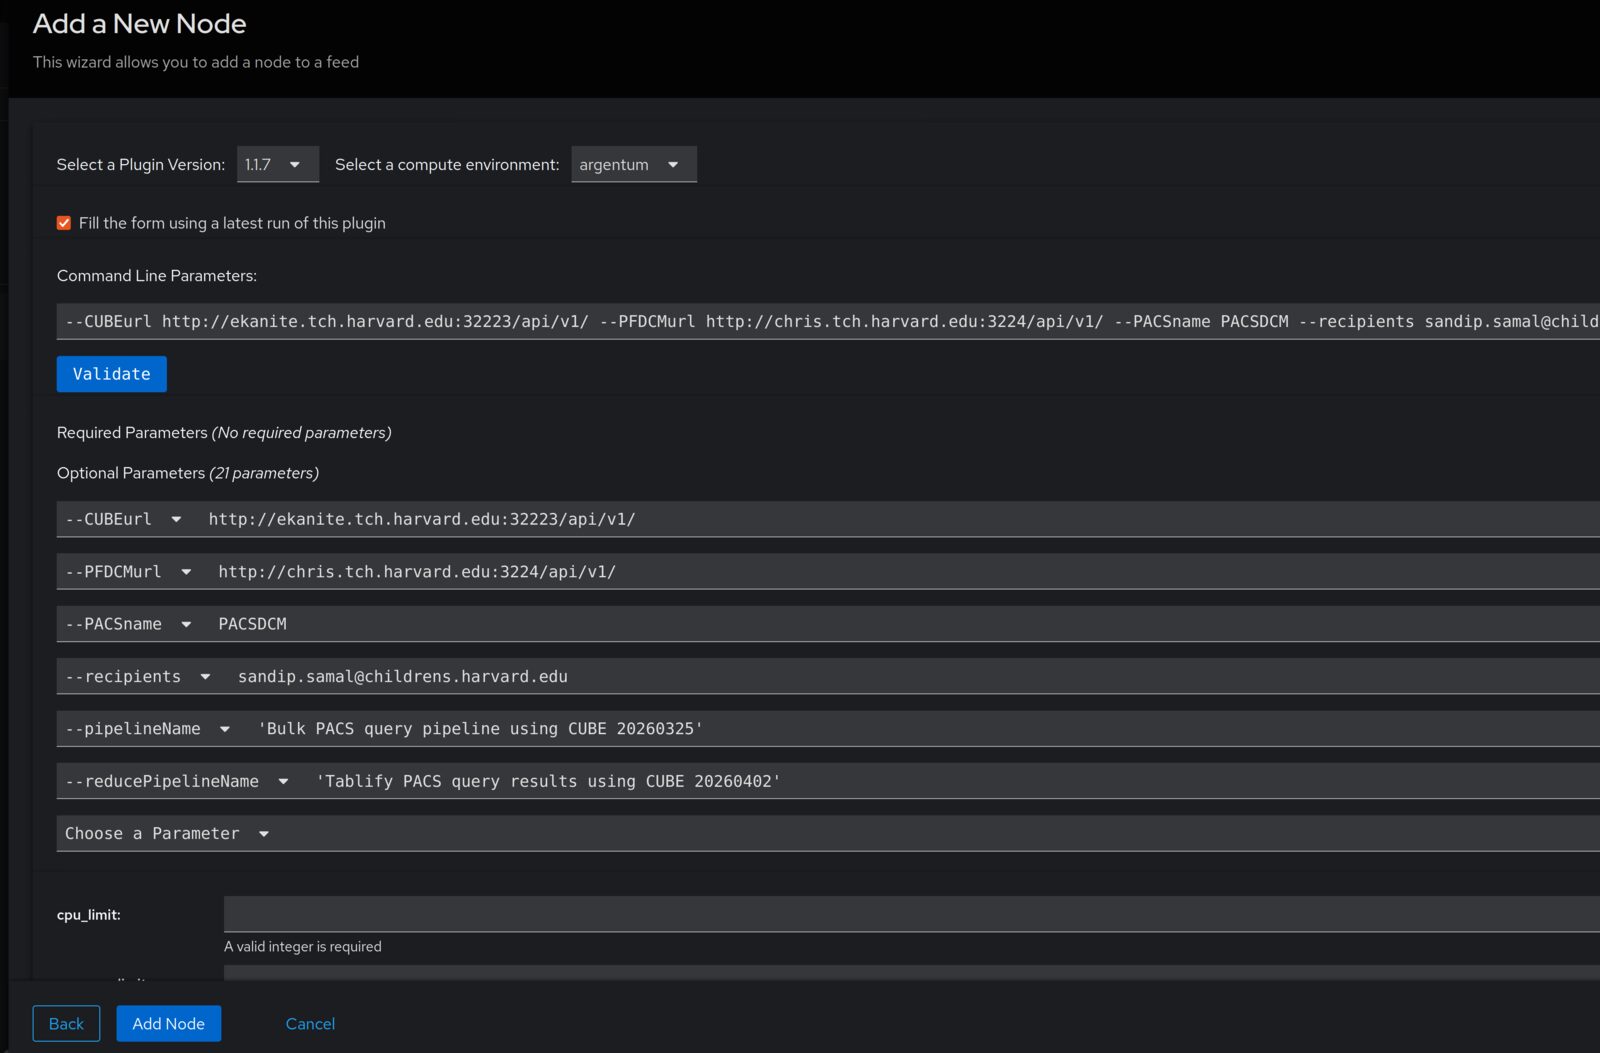
Figure A7 — Add a New Node wizard for pl-dyanon, fully populated with --pipelineName and --reducePipelineName
Step 7. Confirm the node was added and monitor the pipeline
After adding the node, the feed graph updates to show the new pl-dircopy / pl-dyanon branch hanging off the root, fanning out into many parallel child nodes (one per search row / worker) that converge into the Tablify reduce step. Node color indicates status: blue nodes are running/queued, white nodes are pending, and red nodes indicate errors.
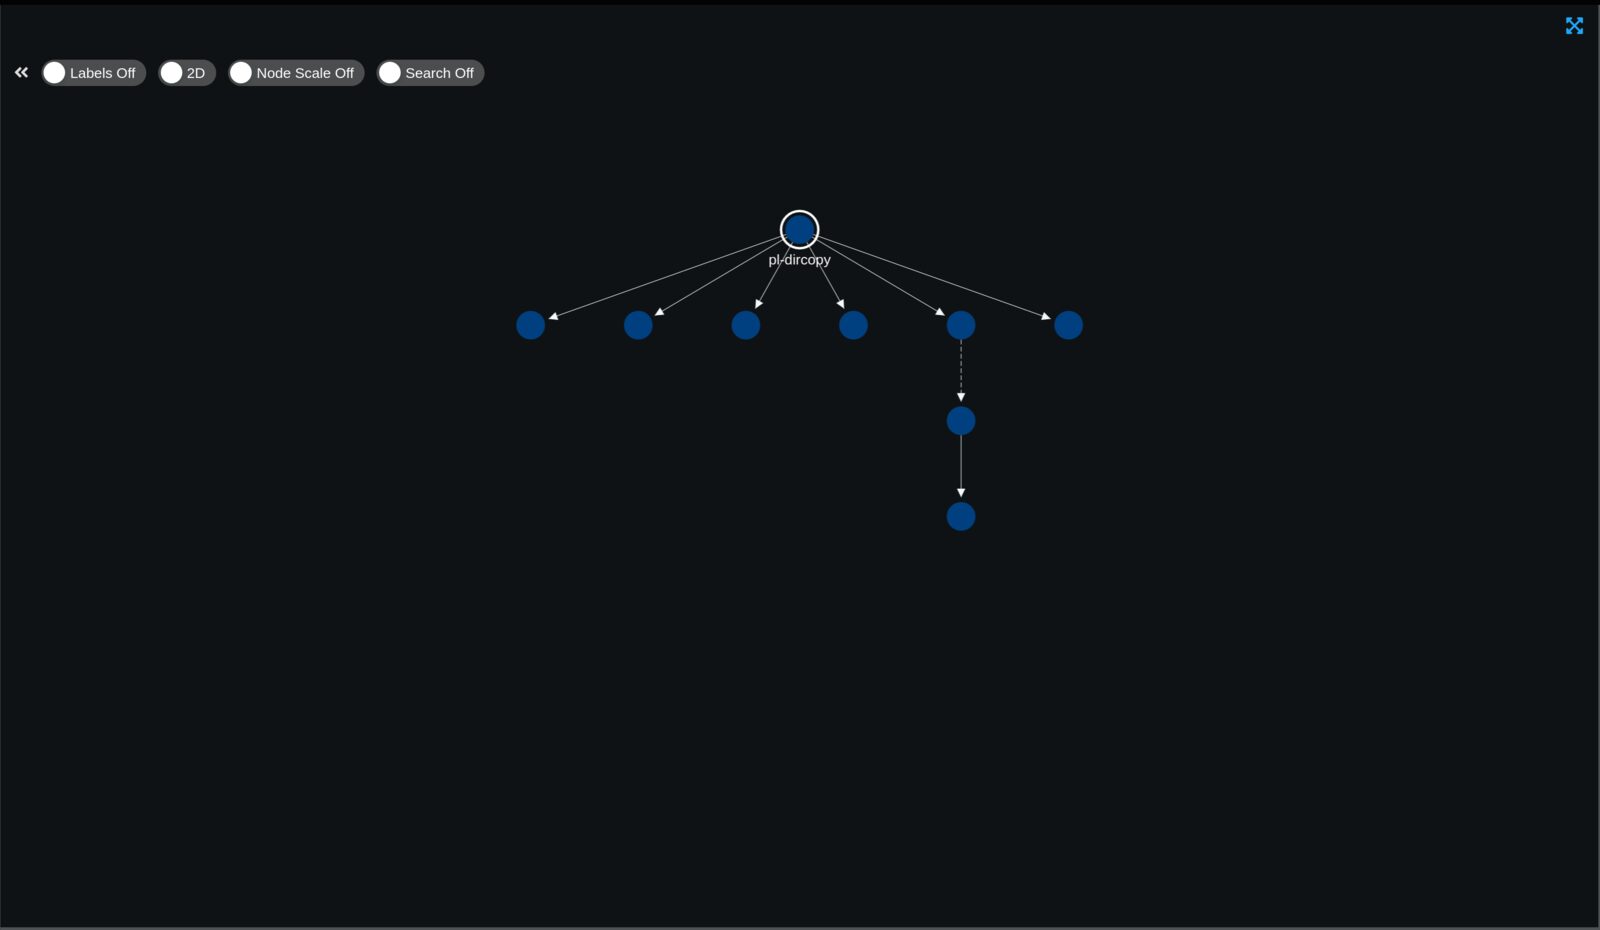
Figure A8 — Feed graph after adding the pl-dircopy / pl-dyanon branch, fanning out across parallel worker nodes
Note: Wait for all branches to reach a completed (checkmark) status before proceeding to Part B. You will receive an email at the address given via
--recipientswhen the run finishes.
Part B — Bulk Retrieve
Use this workflow to retrieve (and optionally anonymize) the DICOM series identified by the bulk query, and convert them to NIfTI, using the pl-dypxflow plugin.
Step 1. Download the query results
- Navigate to the Tablify / JSON-to-table node produced at the end of Part A.
- In the file browser panel, check the box next to
output_data.csv. - Click the download icon (Download selected items) to save the file locally.
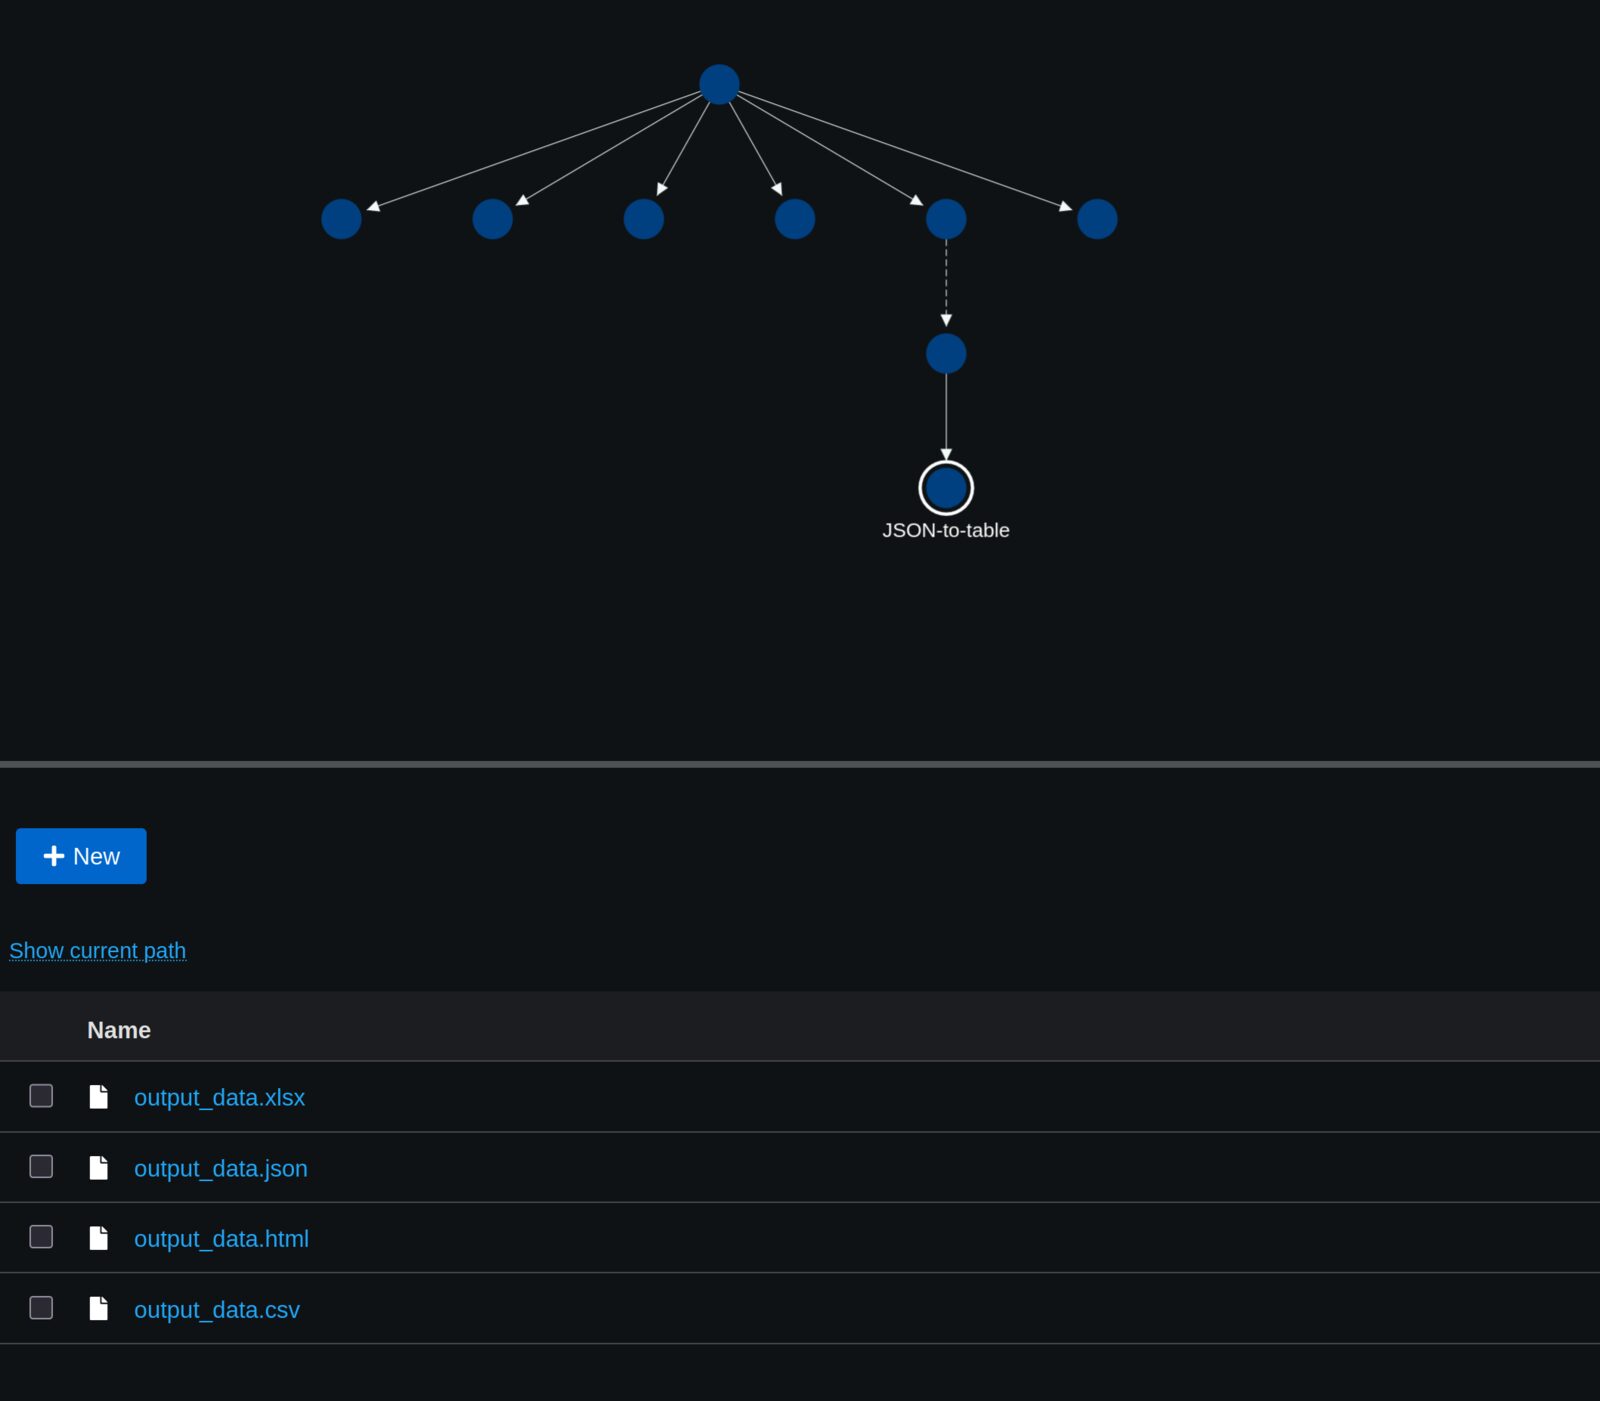
Figure B1 — JSON-to-table node output files (nothing selected)
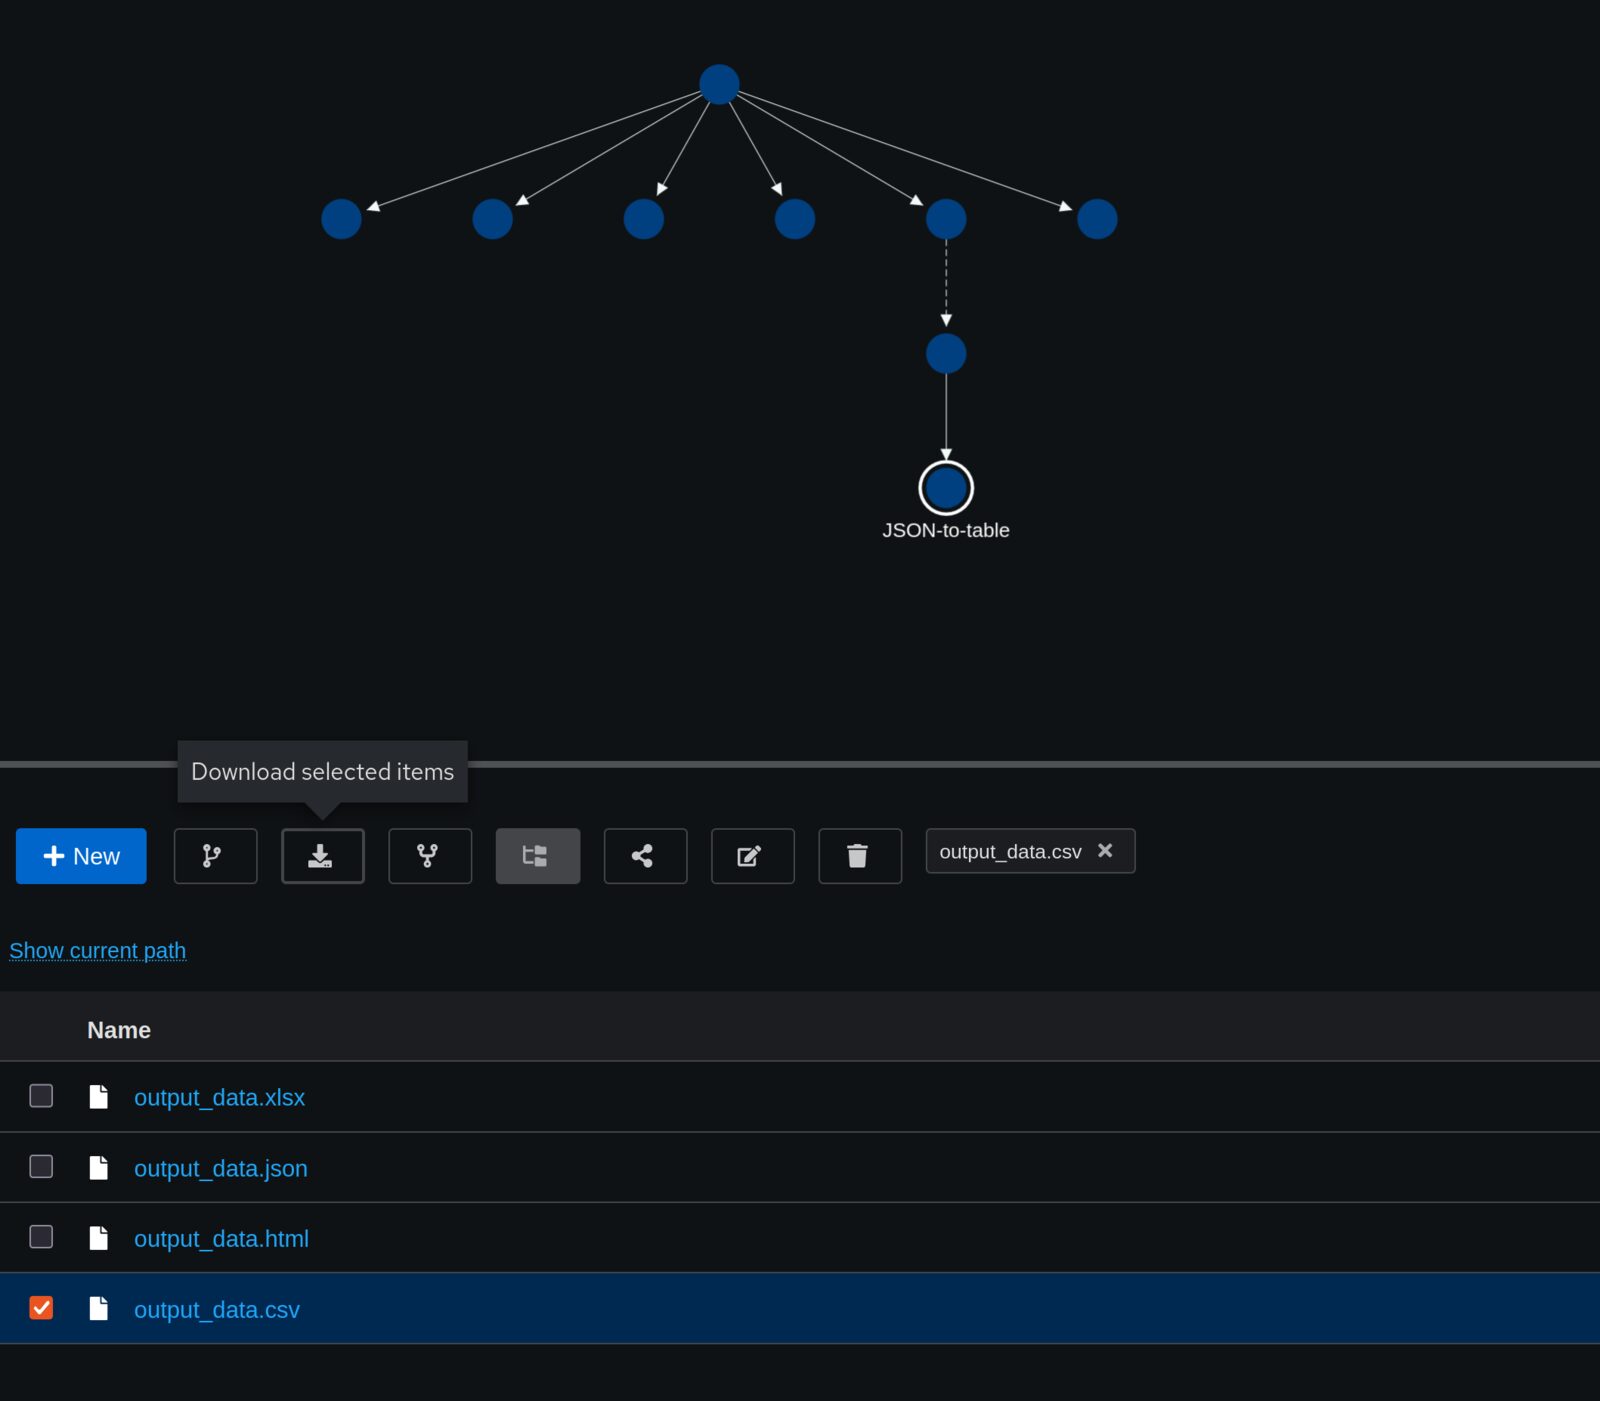
Figure B2 — output_data.csv selected, ready to download via the download icon
Step 2. Prepare the retrieve CSV
Before uploading, edit the downloaded CSV so it matches bulk_retrieve_spec.csv:
- Rename the identifying columns to
Search_<column_name>(e.g.Search_AccessionNumber). - Folder name — the name of the output folder created for each record/row.
- Dicom path, Dicom anonymized path, and Nifti path — destination paths under the
/neurotree for each output type. - status — set any character in this column to skip that row entirely.
- Leave
Dicom anonymized path/Nifti pathblank if you do not want anonymized DICOMs or NIfTI files saved.
⚠️ Important — destination paths must be world-writable. Every destination path you specify (
Dicom path,Dicom anonymized path,Nifti path) must have world-writable permissions on the/neurofilesystem before you run the pipeline. ChRIS pushes output data to these paths as part of the pipeline run, and if the target directory isn't writable, the push will silently fail and no data will be delivered for that row. Confirm permissions (or ask your system administrator to set them) on each destination path ahead of time.
bulk_retrieve_spec.csv columns
| Column | Purpose |
|---|---|
PatientID | Patient identifier |
PatientName | Patient name |
PatientBirthDate | Patient date of birth |
Modality | Imaging modality (e.g. MR, CT, SR) |
StudyDate | Date of the study |
Search_AccessionNumber | Accession number used to locate the study on the PACS |
Search_SeriesDescription | Description of the series used to locate the sequence in the study |
NumberOfSeriesRelatedInstances | Number of instances in the series |
Dicom path | Destination path under /neuro for the retrieved DICOMs — must be world-writable |
Dicom anonymized path | Destination path under /neuro for anonymized DICOMs (leave blank to skip) — must be world-writable if used |
Nifti path | Destination path under /neuro for the converted NIfTI files (leave blank to skip) — must be world-writable if used |
Folder name | Name of the output folder created for this record/row |
status | Set any character to skip this row |
Step 3. Log in and create a new analysis for the retrieve step
- Log in to ChRIS as in Part A (see Figure A1).
- Open Create Analysis, give the analysis a name (e.g. "demo-retrieve-2"), and proceed through the wizard as in Part A Steps 2–4.
- Upload the edited retrieve CSV from Step 2 above as the input data for the new analysis, instead of the query template.
Figure B3 — ChRIS single sign-on login screen (reused from Part A)
Step 4. Add the pl-dypxflow child node
- Open the new analysis and right-click the root (pl-dircopy) node.
- Choose + Add a Child Node from the context menu.
- Search for and select the plugin pl-dypxflow.
Figure B4 — Add a Child Node context menu on the pl-dircopy root node (reused from Part A)
Step 5. Configure the pl-dypxflow node
- Select the plugin version (e.g. 1.1.5) and the
argentumcompute environment. - Check Fill the form using a latest run of this plugin to auto-populate parameters.
- If parameters are not auto-filled, paste the following into Command Line Parameters:
--pattern '**/*.csv' --CUBEurl http://ekanite.tch.harvard.edu:32223/api/v1/
--PFDCMurl http://chris.tch.harvard.edu:3224/api/v1/ --PACSname PACSDCM
--recipients example@abc.com
- Click Validate, then Add Node.
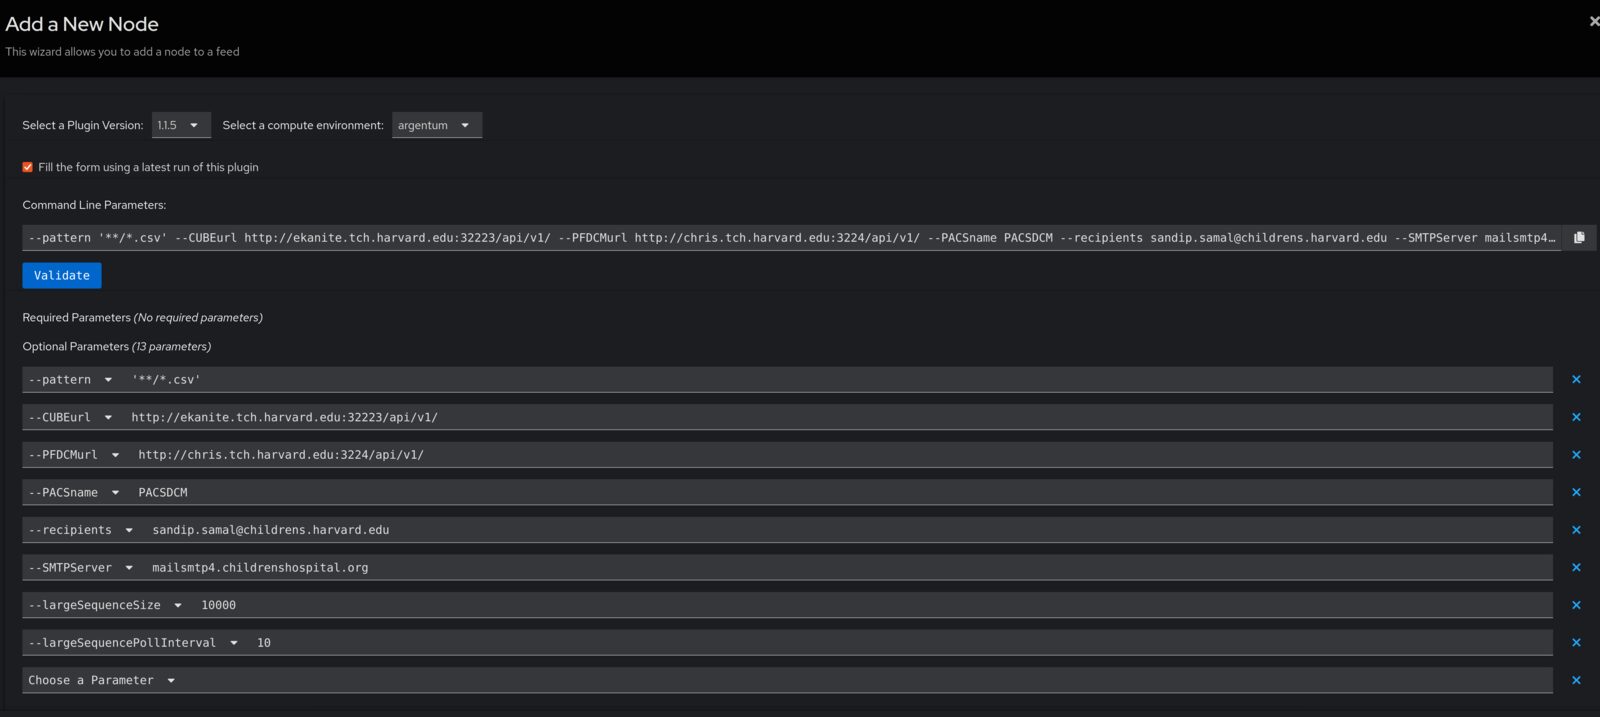
Figure B5 — Add a New Node wizard for pl-dypxflow, fully populated command line parameters
Step 6. Monitor the retrieve pipeline
Once added, the node begins execution. The right-hand details panel shows live status (Waiting, Started, Transmitting, Computing) along with Feed Name, Parent/Selected Node IDs, Plugin version, Compute Environment, and Total Runtime.
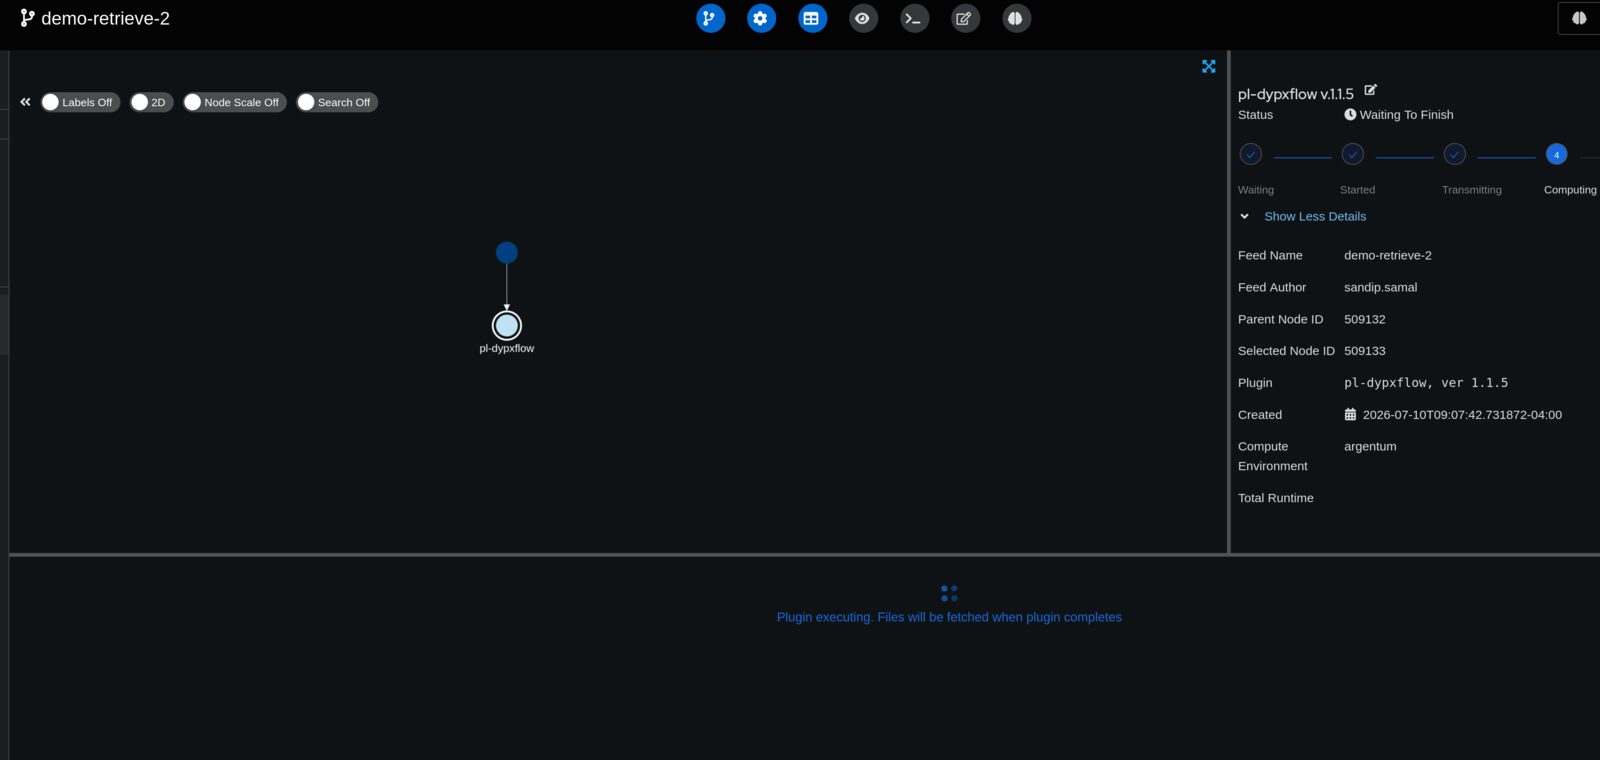
Figure B6 — demo-retrieve-2 feed: pl-dypxflow node in the Computing stage, waiting to finish
Note: The message "Plugin executing. Files will be fetched when plugin completes" confirms the node is actively running.
Step 7. Review the full pipeline graph
Once complete, the feed graph shows the full pipeline: the root node, the pl-dyanon / pl-dypxflow branches, and every downstream worker and reduce node. Completed nodes typically render blue; nodes needing attention render white or red.

Figure B7 — Complete end-to-end pipeline graph after the retrieve step finishes
Appendix: CSV Templates
bulk_query_spec.csv
Used as the input for Part A. Each row specifies one search; add as many Search_<tagName> columns as needed.
| Search_PatientID | Search_StudyDate | Search_<tagName> |
|---|---|---|
| 1234567 | 19000101 | <tagValue> |
bulk_retrieve_spec.csv
Used as the input for Part B, produced by editing the Part A query results. It contains the following columns:
| Column |
|---|
PatientID |
PatientName |
PatientBirthDate |
Modality |
StudyDate |
Search_AccessionNumber |
Search_SeriesDescription |
NumberOfSeriesRelatedInstances |
Dicom path |
Dicom anonymized path |
Nifti path |
Folder name |
status |
See the full column-by-column description in Part B, Step 2 — Prepare the retrieve CSV.
Quick Reference: Command Line Parameters
pl-dyanon (Bulk Query)
--CUBEurl http://ekanite.tch.harvard.edu:32223/api/v1/ --PFDCMurl http://chris.tch.harvard.edu:3224/api/v1/
--PACSname PACSDCM --recipients example@abc.com
--pipelineName 'Bulk PACS query pipeline using CUBE 20260325'
--reducePipelineName 'Tablify PACS query results using CUBE 20260402'
pl-dypxflow (Bulk Retrieve)
--pattern '**/*.csv' --CUBEurl http://ekanite.tch.harvard.edu:32223/api/v1/
--PFDCMurl http://chris.tch.harvard.edu:3224/api/v1/ --PACSname PACSDCM
--recipients example@abc.com