For Users
Datasets containing volumetric data can be visualized using the "Visual Datasets" feature
by processing the dataset with the plugin pl-visual-dataset as described in the page
"For Dataset Publishers". In the feed view of ChRIS_ui, an
additional button appears for pl-visual-dataset nodes, labeled "View Volumes".
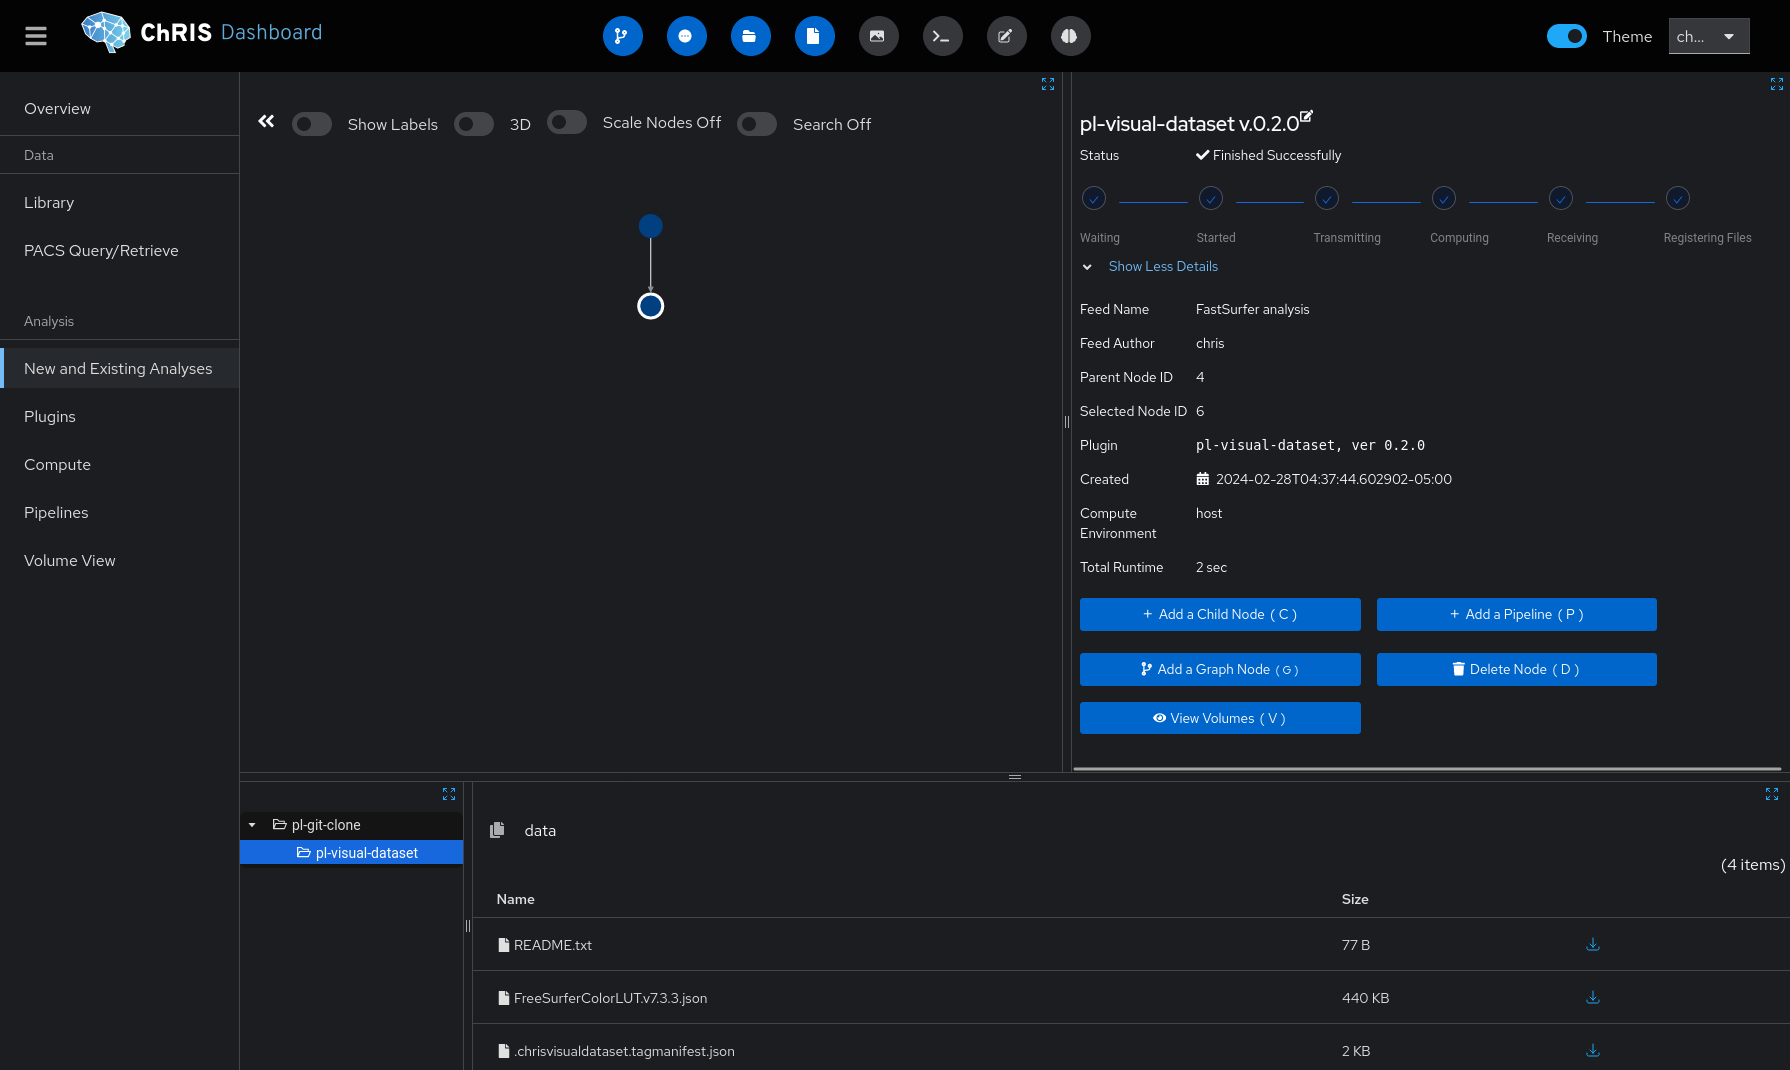
Clicking the button takes you to "Volume View". You can click the feed icon next to the feed title in the top-left to go back.
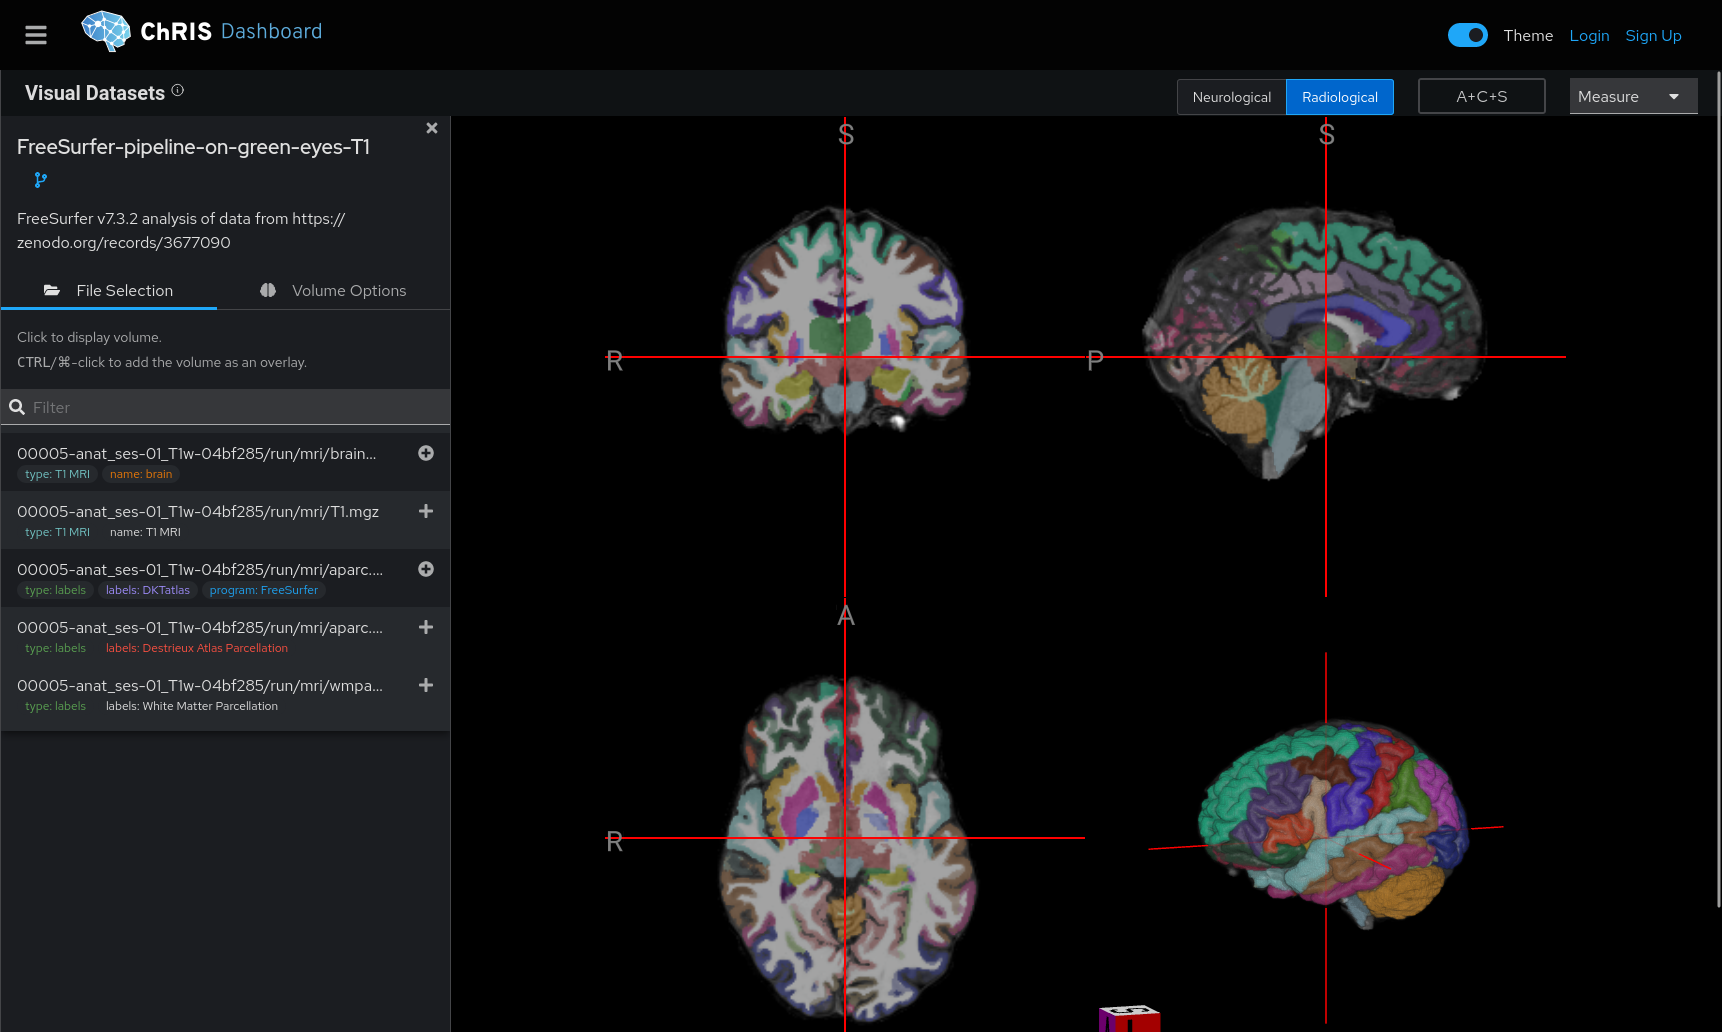
There is a list of files in the sidebar. The files can be filtered by typing in the search bar, or by clicking on a "tag" to filter by tag.
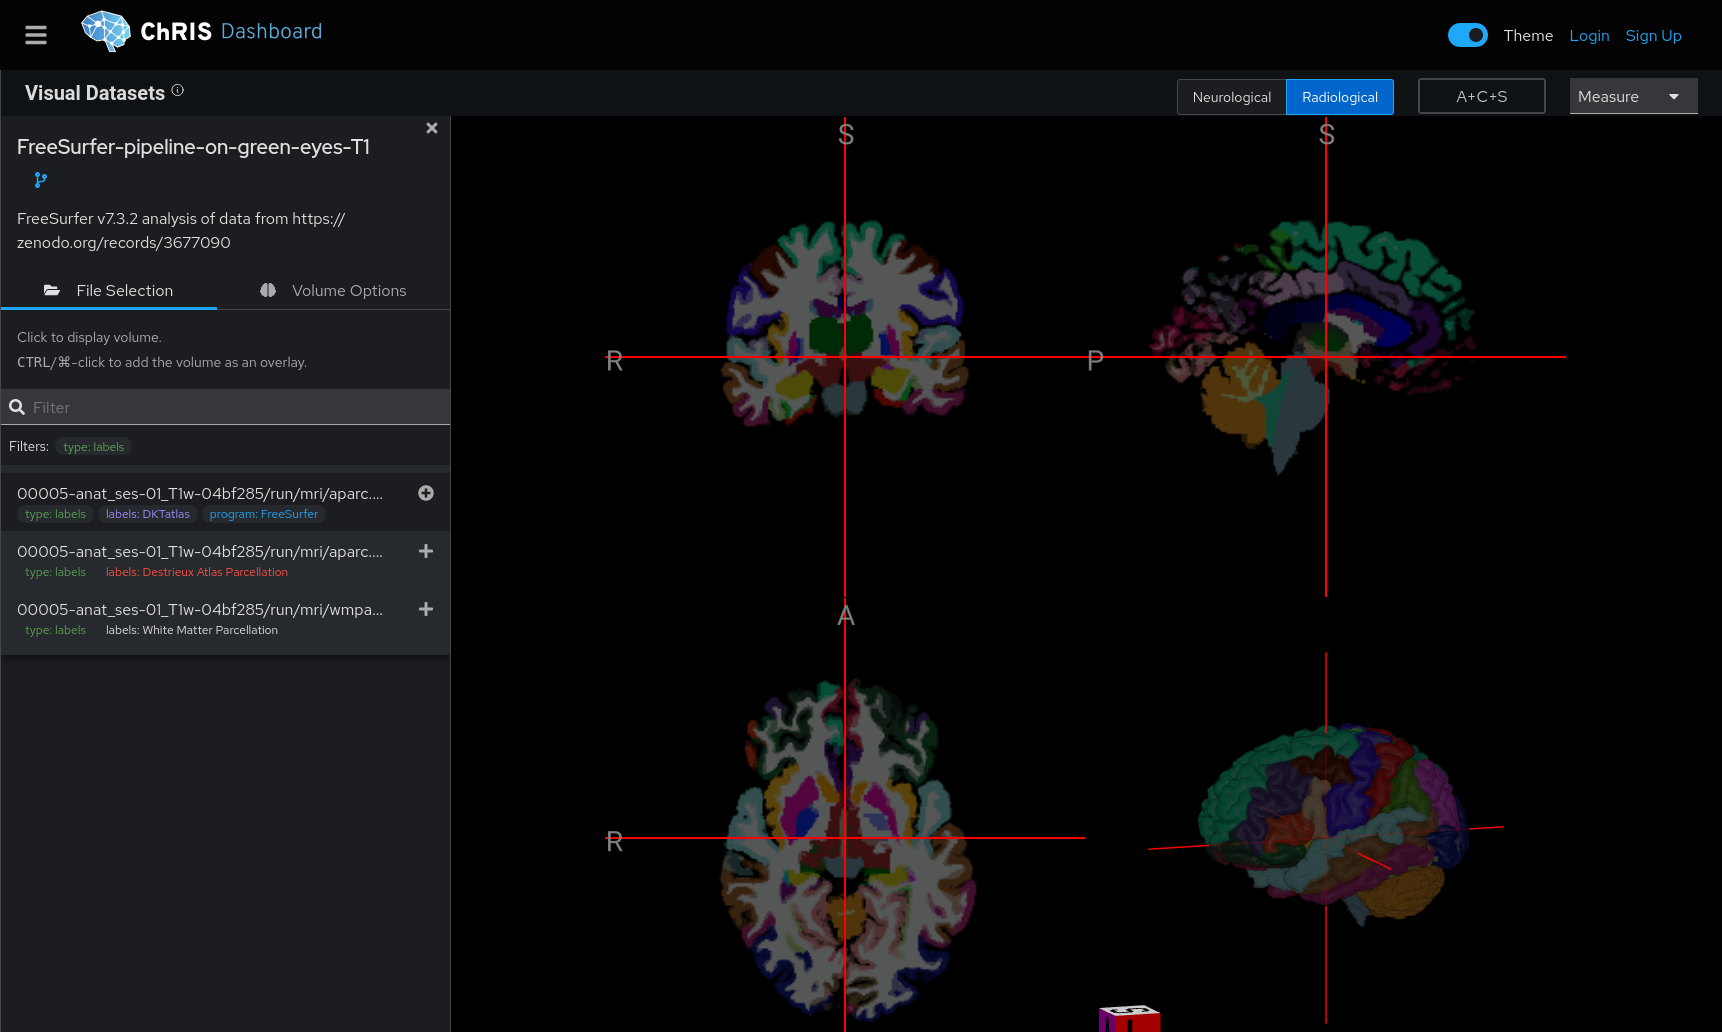
Click on a file to open it, or CTRL/⌘-click to overlay the file on top of another selected file. When volume labels are loaded, you can see the name of the label at the bottom of the screen.
Select the T1/T2 MRI volume first, and select the labels last.
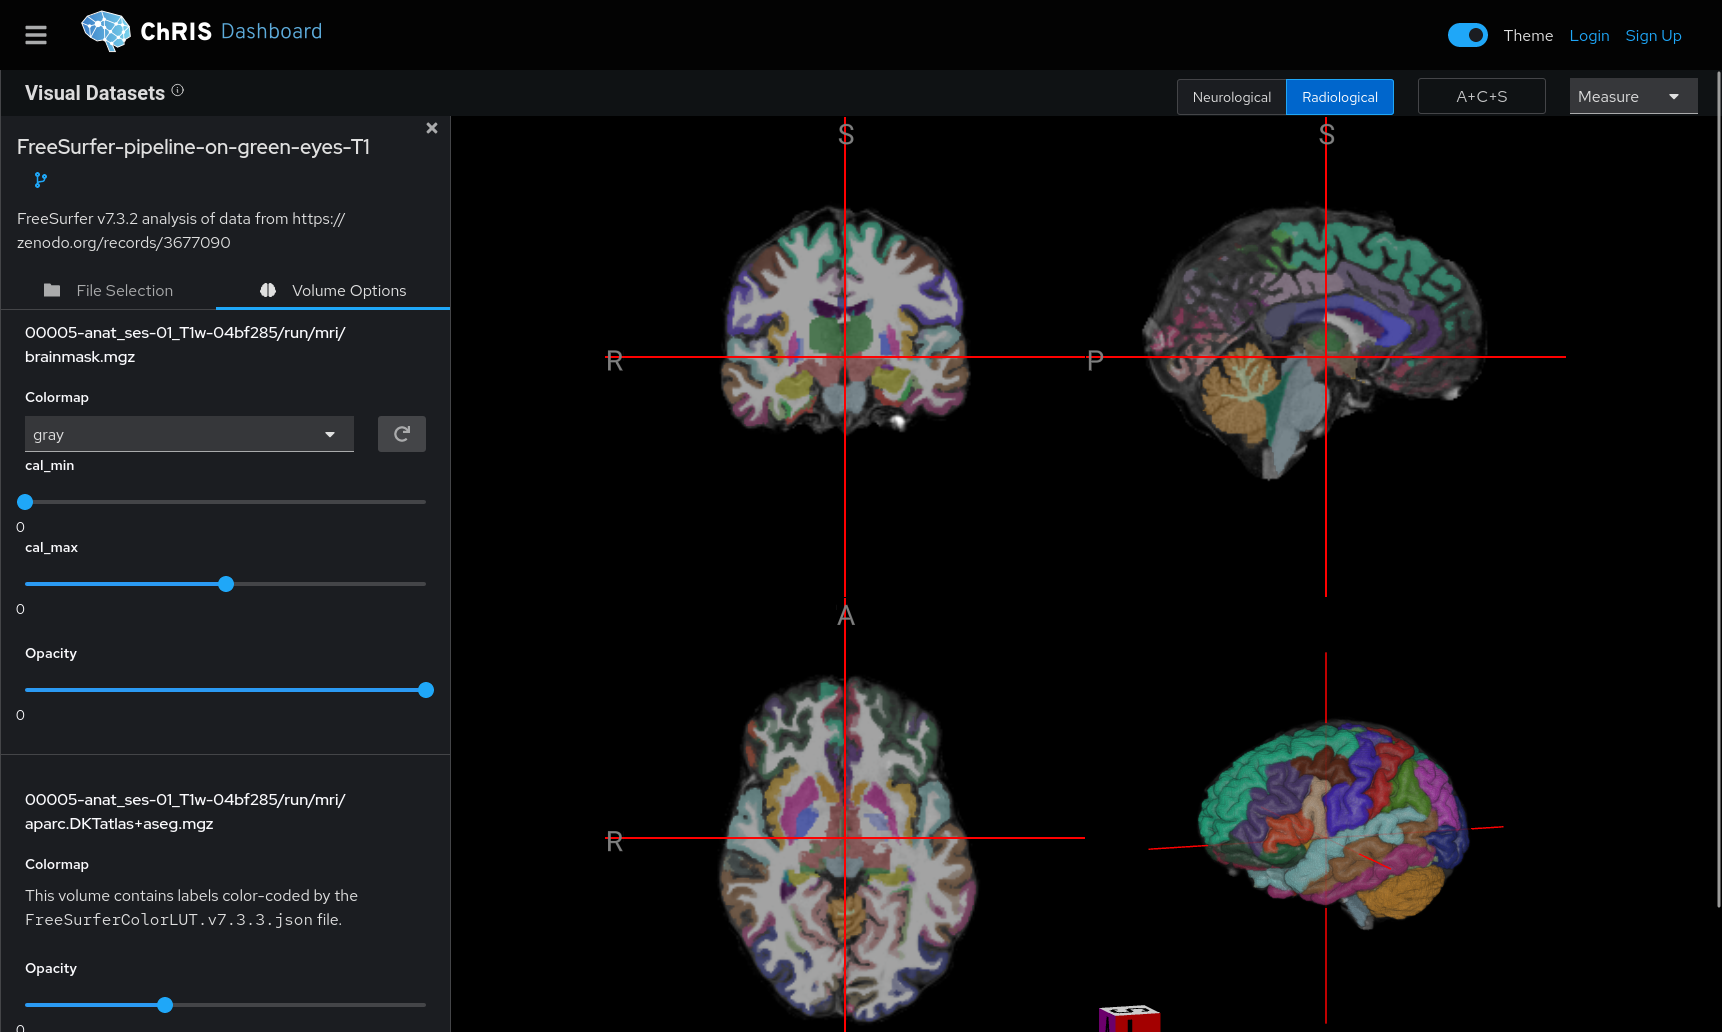
With one or more files selected, volume options can be adjusted in the "Volume Options" tab.
Image contrast can be adjusted by cal_min and cal_max sliders. There is also a slider for opacity.
On desktop layouts, additional tools and controls can be found in the top right corner. For example, select the "Measurement tool" to measure distances.