Hitchhiking on OpenShift's Observability using Custom Grafana Dashboards

OpenShift provides some observability features out-of-the-box, but which features are available depends on what your cluster admin has working and what you have access to. On the NERC, we are able to see container metrics in OpenShift Developer's built-in dashboard. To enable custom visualizations, metrics analysis, and alerting, we need to connect this data to an instance of Grafana which we control.
Finding the Prometheus Endpoint
Red Hat has a couple of articles (1, 2) about how to connect OpenShift to Grafana to build custom dashboards, however their approach is to connect to an internal "thanos-querier" service using a service account with a cluster role. Regular users cannot create cluster roles, so these solutions don't work for us. Nevertheless, it should be possible to query OpenShift's "built-in" Prometheus as regular users since we can do it from the OpenShift web console's developer view.
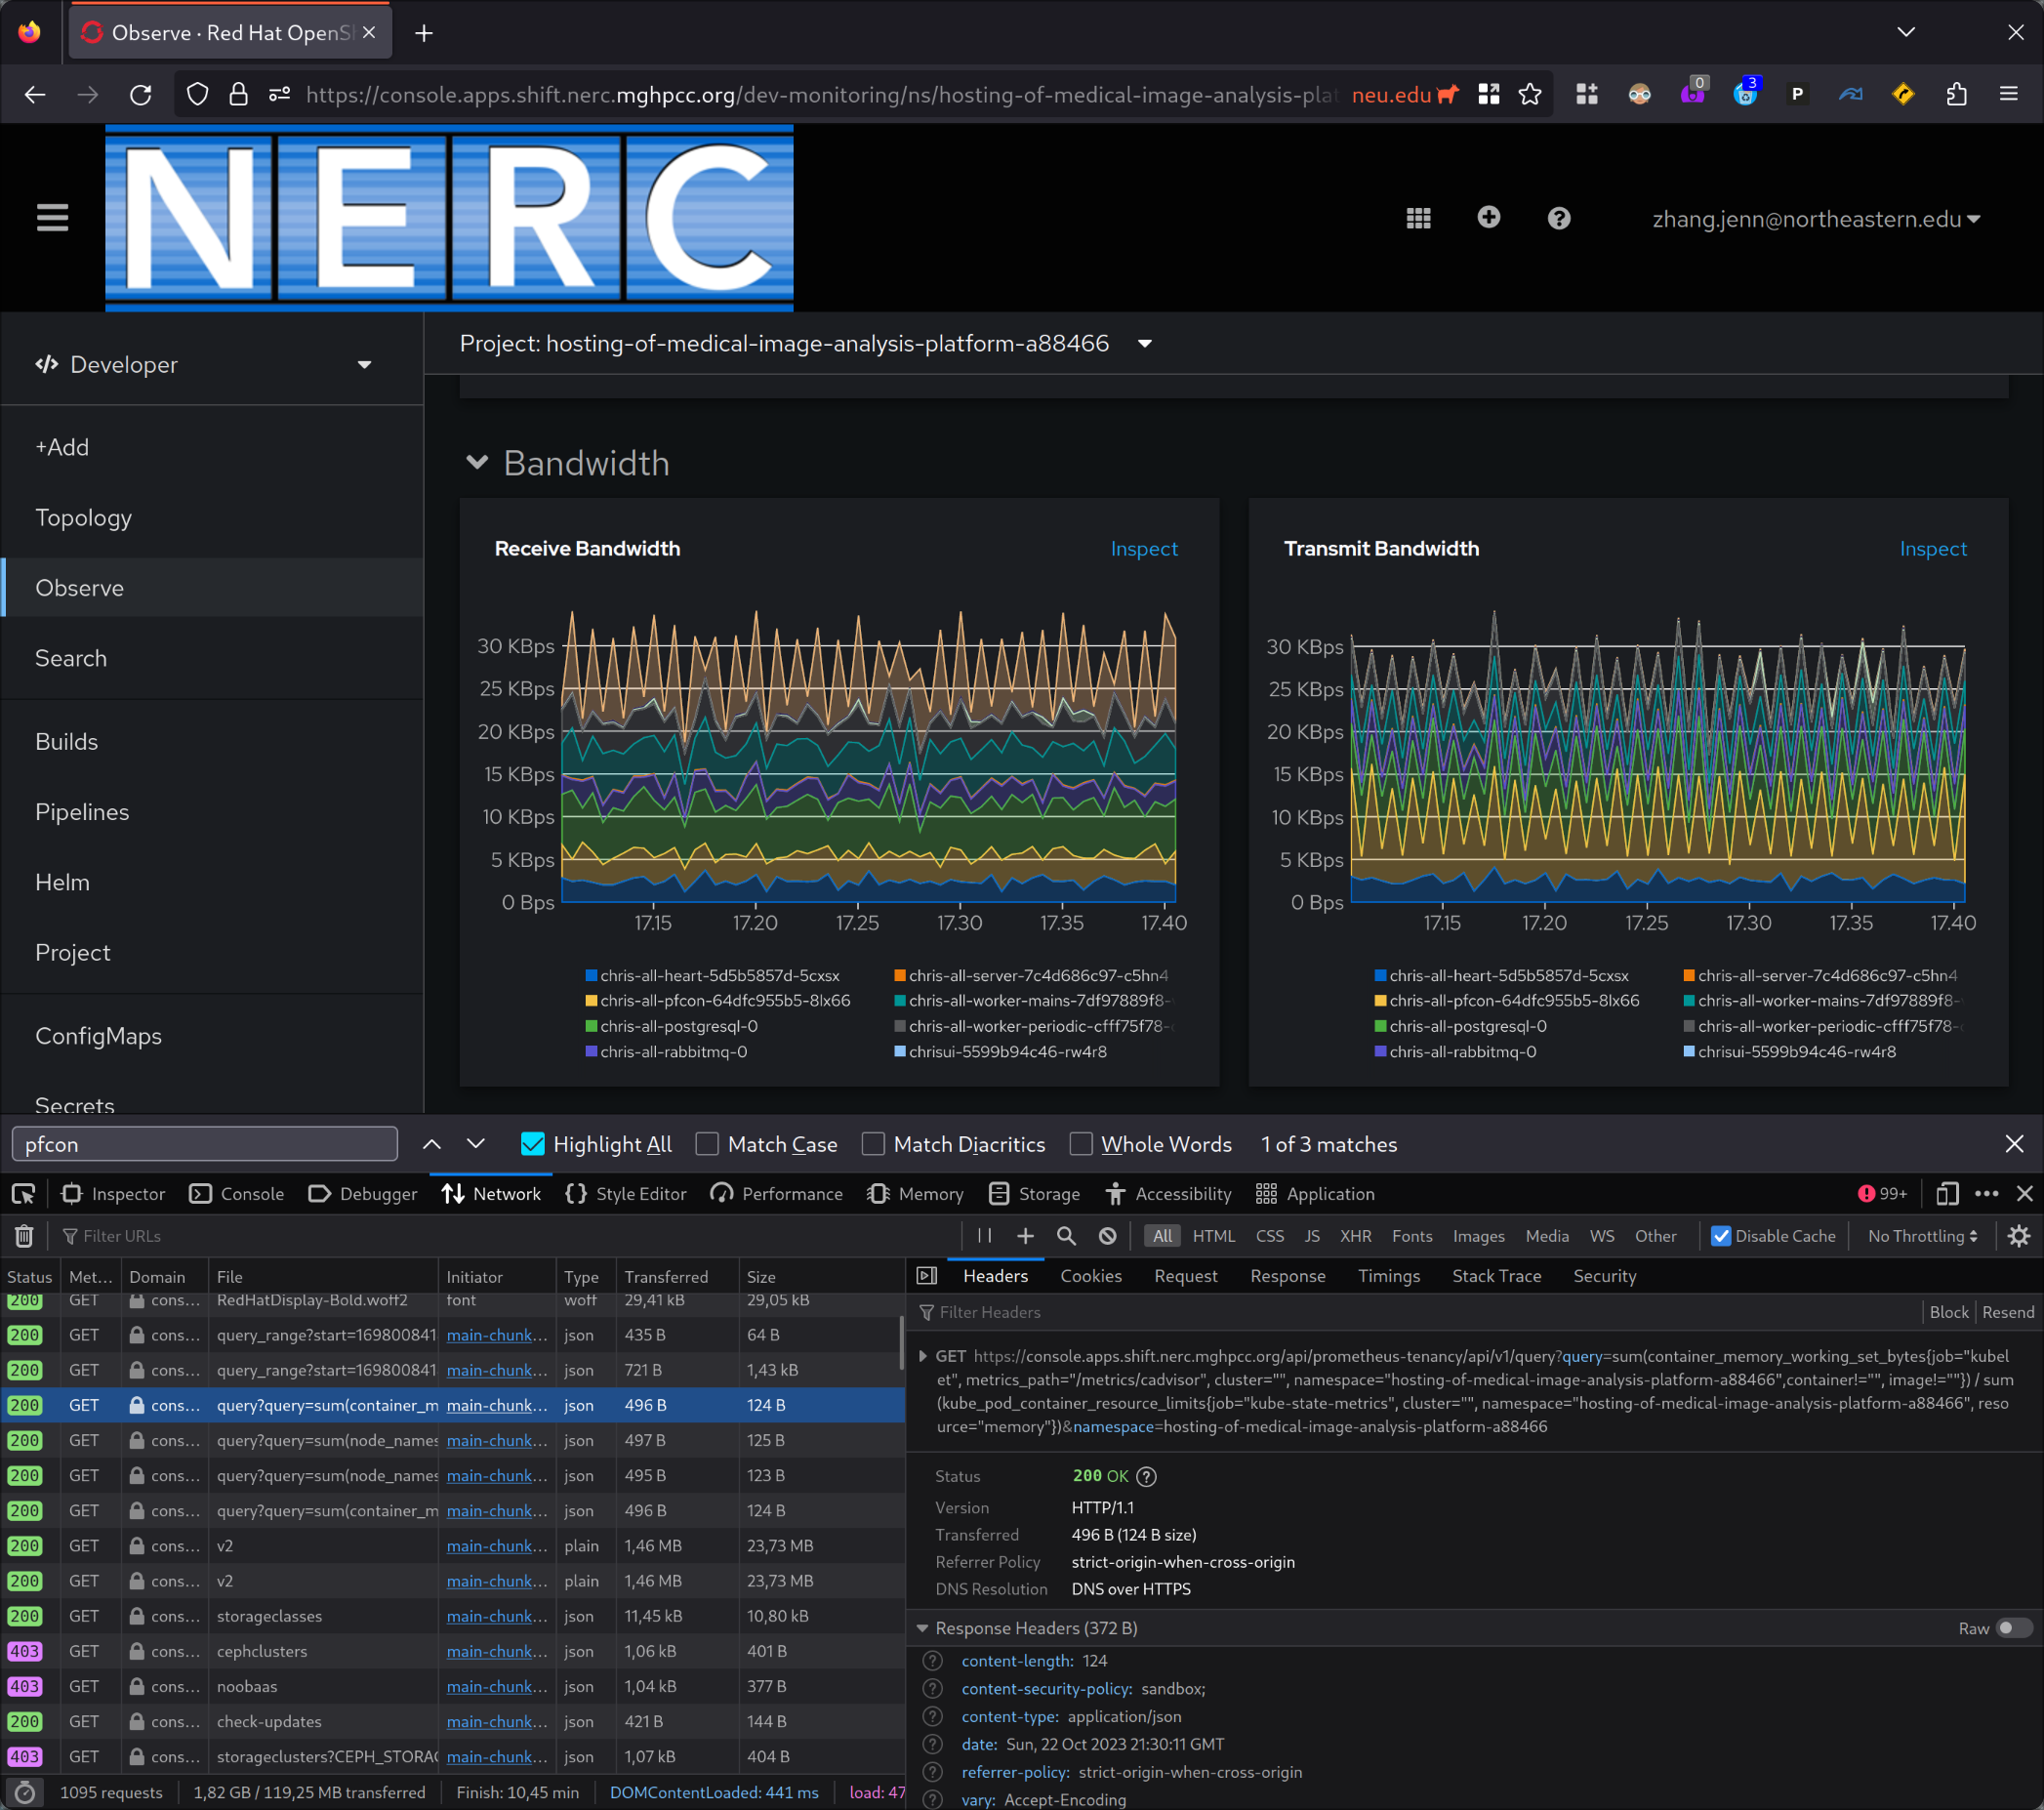
By pressing f12 to open up Firefox's devtools we can see that the page is making
requests to the URL https://console.apps.shift.nerc.mghpcc.org/api/prometheus-tenancy/api/v1/,
and its API is the same as Prometheus' API. This looks like our way into OpenShift's internal
instance of Prometheus.
Authentication with prometheus-tenancy
The tricky part is authentication. We need to create a token so that Grafana can make requests
to the Prometheus API. To obtain a token, we need to create a ServiceAccount, then we need to
give the ServiceAccount the relevant permissions via a Role and RoleBinding to be able
to access the Prometheus API.
oc create sa external-grafana
token="$(oc create token --duration=99999h external-grafana)"
I got an example request by copying a query from devtools with the option "Copy as cURL". This gives me a command which I can use to test whether my token can authenticate with Prometheus.
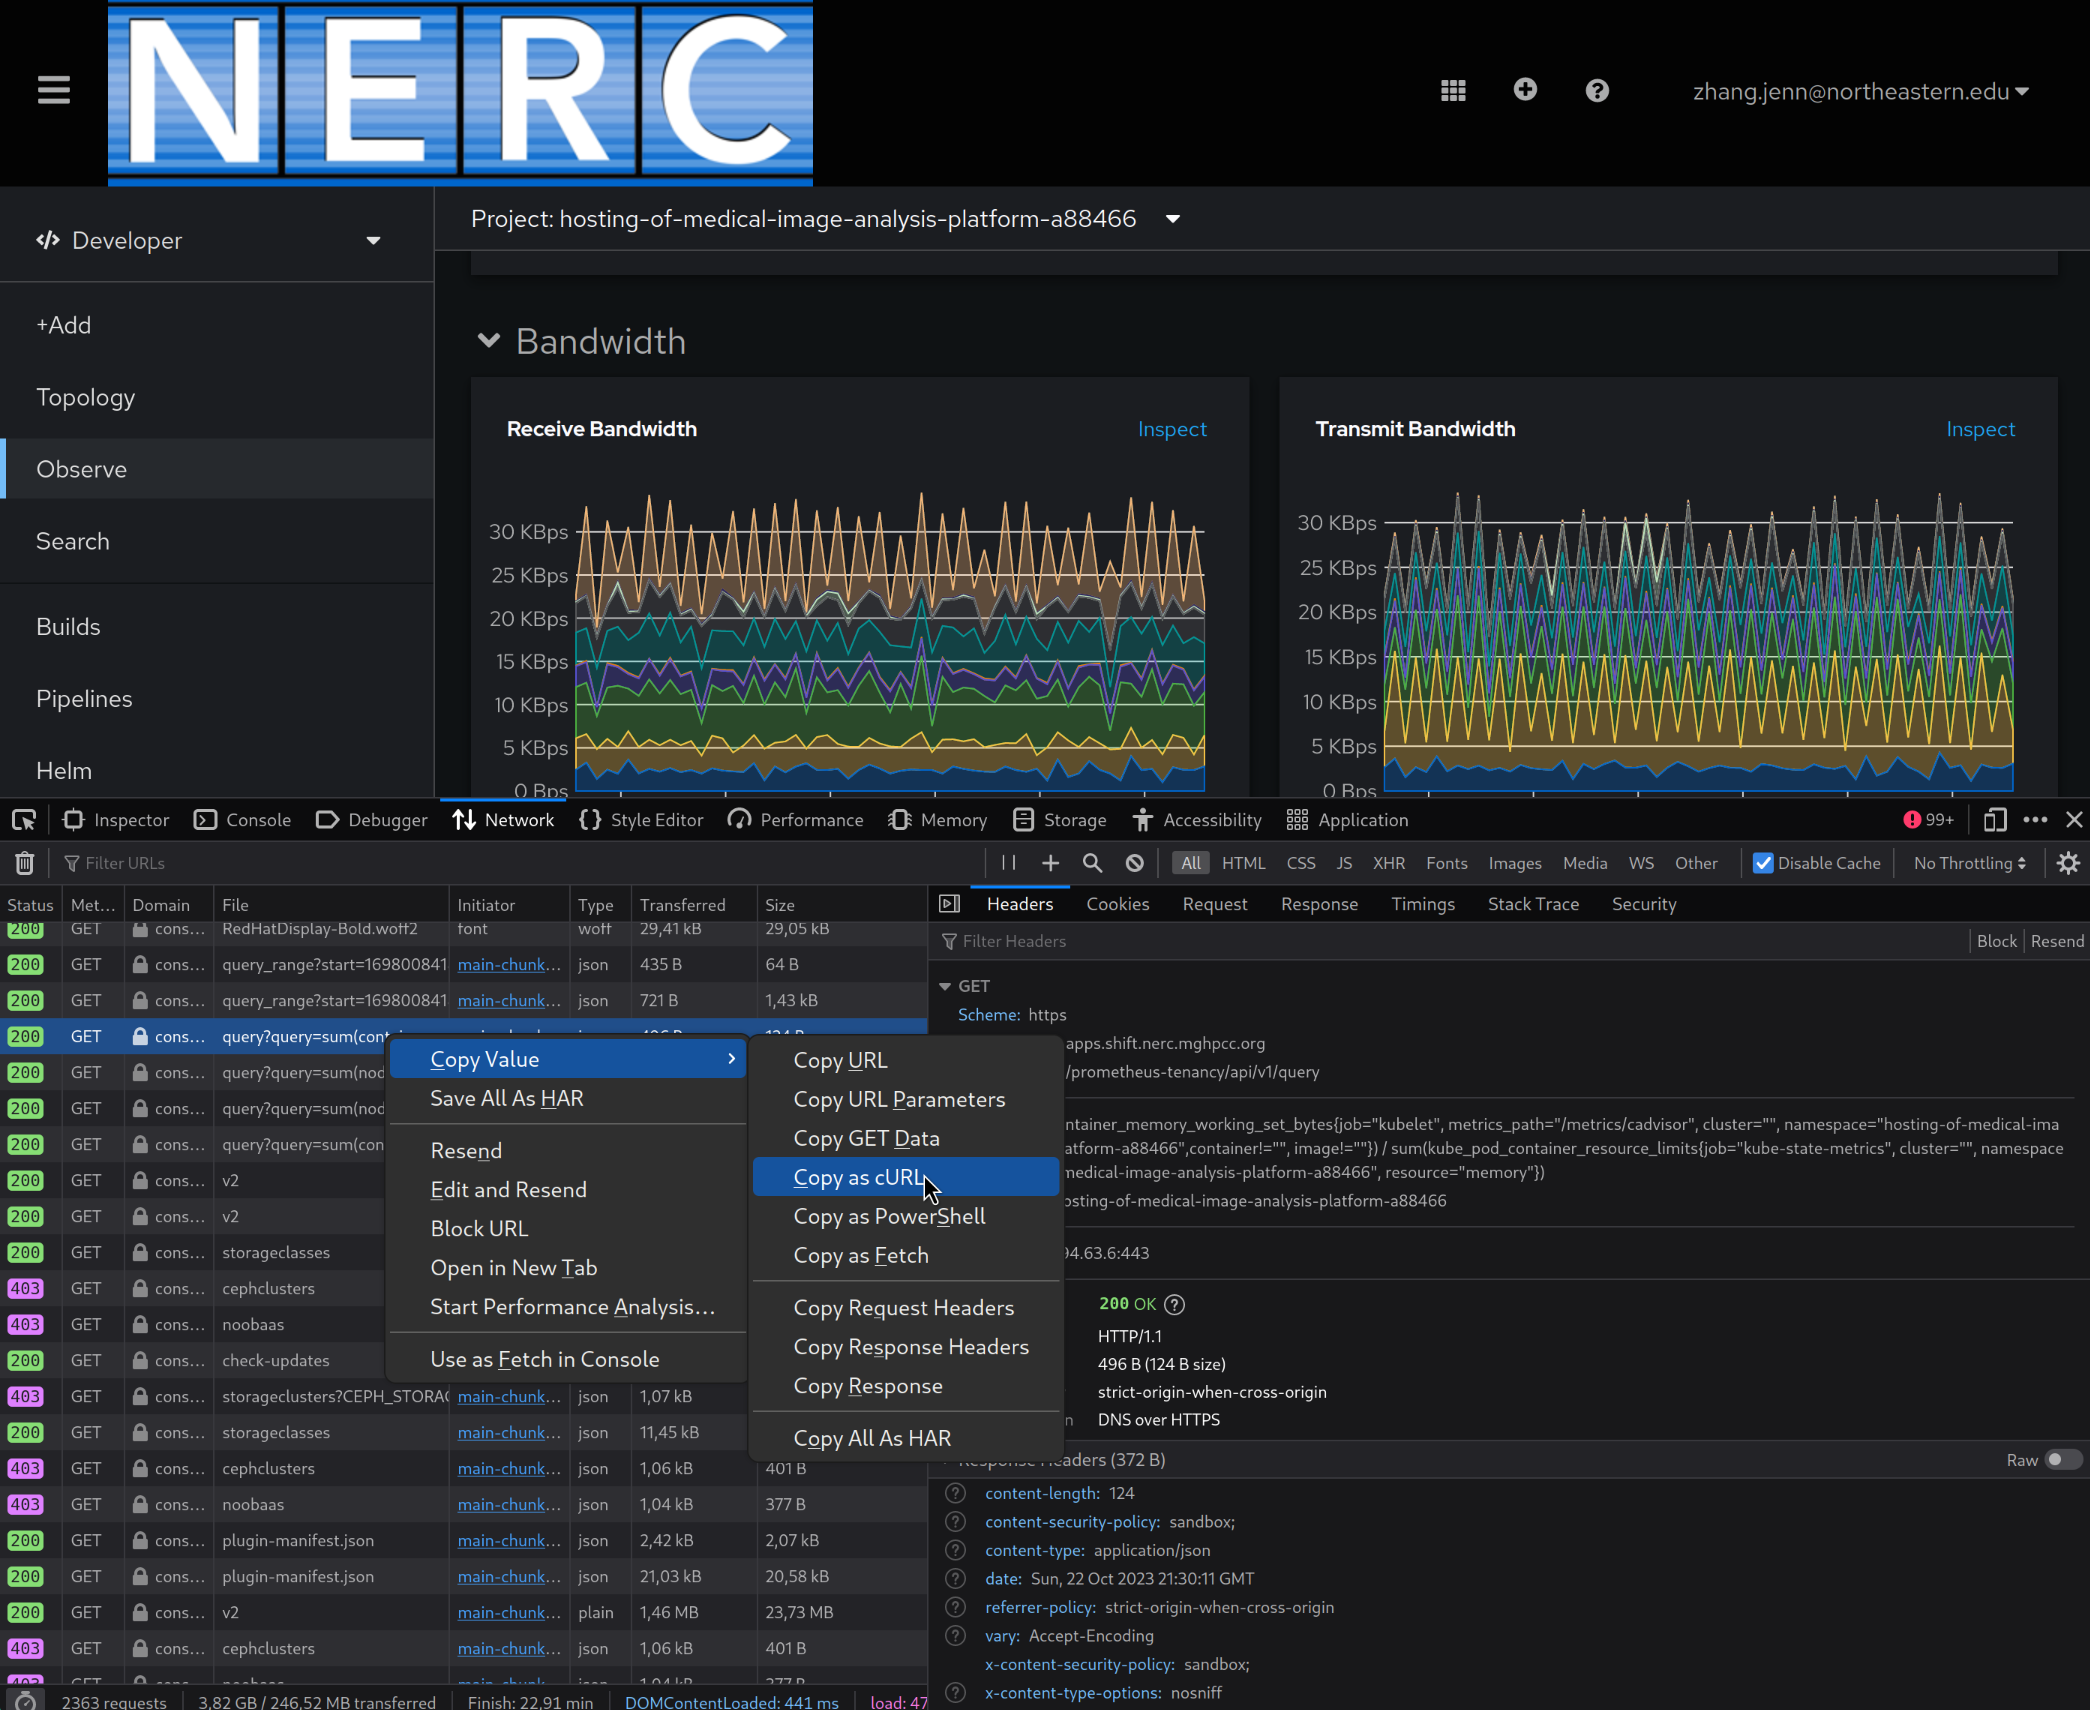
The curl command I copied is pasted below, with unnecessary -H options deleted.
I also added -i, which tells curl to print the response headers.
curl -i 'https://console.apps.shift.nerc.mghpcc.org/api/prometheus-tenancy/api/v1/query?query=sum%28container_memory_working_set_bytes%7Bjob%3D%22kubelet%22%2C+metrics_path%3D%22%2Fmetrics%2Fcadvisor%22%2C+cluster%3D%22%22%2C+namespace%3D%22hosting-of-medical-image-analysis-platform-a88466%22%2Ccontainer%21%3D%22%22%2C+image%21%3D%22%22%7D%29+%2F+sum%28kube_pod_container_resource_limits%7Bjob%3D%22kube-state-metrics%22%2C+cluster%3D%22%22%2C+namespace%3D%22hosting-of-medical-image-analysis-platform-a88466%22%2C+resource%3D%22memory%22%7D%29&namespace=hosting-of-medical-image-analysis-platform-a88466' \
  -H 'Accept: application/json' \
  -H 'Pragma: no-cache' -H 'Cache-Control: no-cache' \
  -H 'Cookie: openshift-session-token=sha256~XXXXXXXX; csrf-token=YYYYYYYY; ZZZZ=AAAA'
It returns something like:
{"status":"success","data":{"resultType":"vector","result":[{"metric":{},"value":[1698013210.062,"0.07837875246062992"]}]}}
So it works! It also works if I delete the csrf-token cookie and everything which follows —
these values are not being checked.
Our next question is: how do we use the service account token instead of my browser session cookie
(which contains my user account oauth API token)? My instinct was to try -H "Authorization: Bearer $token",
however it did not work. Passing my oauth API token in using the Authorization header did not work either.
Through trial and error, I found out that the /api/prometheus-tenancy endpoint authenticates using the Cookie
header only.
curl -i 'https://console.apps.shift.nerc.mghpcc.org/api/prometheus-tenancy/api/v1/query?query=sum%28container_memory_working_set_bytes%7Bjob%3D%22kubelet%22%2C+metrics_path%3D%22%2Fmetrics%2Fcadvisor%22%2C+cluster%3D%22%22%2C+namespace%3D%22hosting-of-medical-image-analysis-platform-a88466%22%2Ccontainer%21%3D%22%22%2C+image%21%3D%22%22%7D%29+%2F+sum%28kube_pod_container_resource_limits%7Bjob%3D%22kube-state-metrics%22%2C+cluster%3D%22%22%2C+namespace%3D%22hosting-of-medical-image-analysis-platform-a88466%22%2C+resource%3D%22memory%22%7D%29&namespace=hosting-of-medical-image-analysis-platform-a88466' \
  -H 'Accept: application/json' \
  -H 'Pragma: no-cache' -H 'Cache-Control: no-cache' \
  -H "Cookie: openshift-session-token=$token"
We get a different error message:
Forbidden (user=system:serviceaccount:hosting-of-medical-image-analysis-platform-a88466:external-grafana, verb=get, resource=pods, subresource=)
This is progress, and fortunately the response tells us exactly what we need. The external-grafana
service account needs permission to the pods resource using the get verb. Let's fix that by
creating a Role and RoleBinding. Just for good measure, we can give the Role all read-only
verbs get, list, and watch.
apiVersion: rbac.authorization.k8s.io/v1
kind: Role
metadata:
  name: prometheus-tenancy-reader
rules:
- apiGroups: [""]
  resources: ["pods"]
  verbs: ["get", "list", "watch"]

---

apiVersion: rbac.authorization.k8s.io/v1
kind: RoleBinding
metadata:
  name: grafana-external-may-read-prometheus-tenancy
roleRef:
  apiGroup: rbac.authorization.k8s.io
  kind: Role
  name: prometheus-tenancy-reader
subjects:
- kind: ServiceAccount
  name: external-grafana
Once I oc apply-ed the Role and RoleBinding, the curl using the service account's $token worked!
Configuring Grafana
Finally, onto configuring Grafana:
- The URL to use is
https://console.apps.shift.nerc.mghpcc.org/api/prometheus-tenancy/?namespace=hosting-of-medical-image-analysis-platform-a88466. It is important to include the query string?namespace=.... - Authentication using the cookie is achieved by setting a "Custom HTTP Header"
Cookiewith the valueopenshift-session-token=.... - "HTTP Method" must be set to "GET".
- "Custom query parameters" should be set to
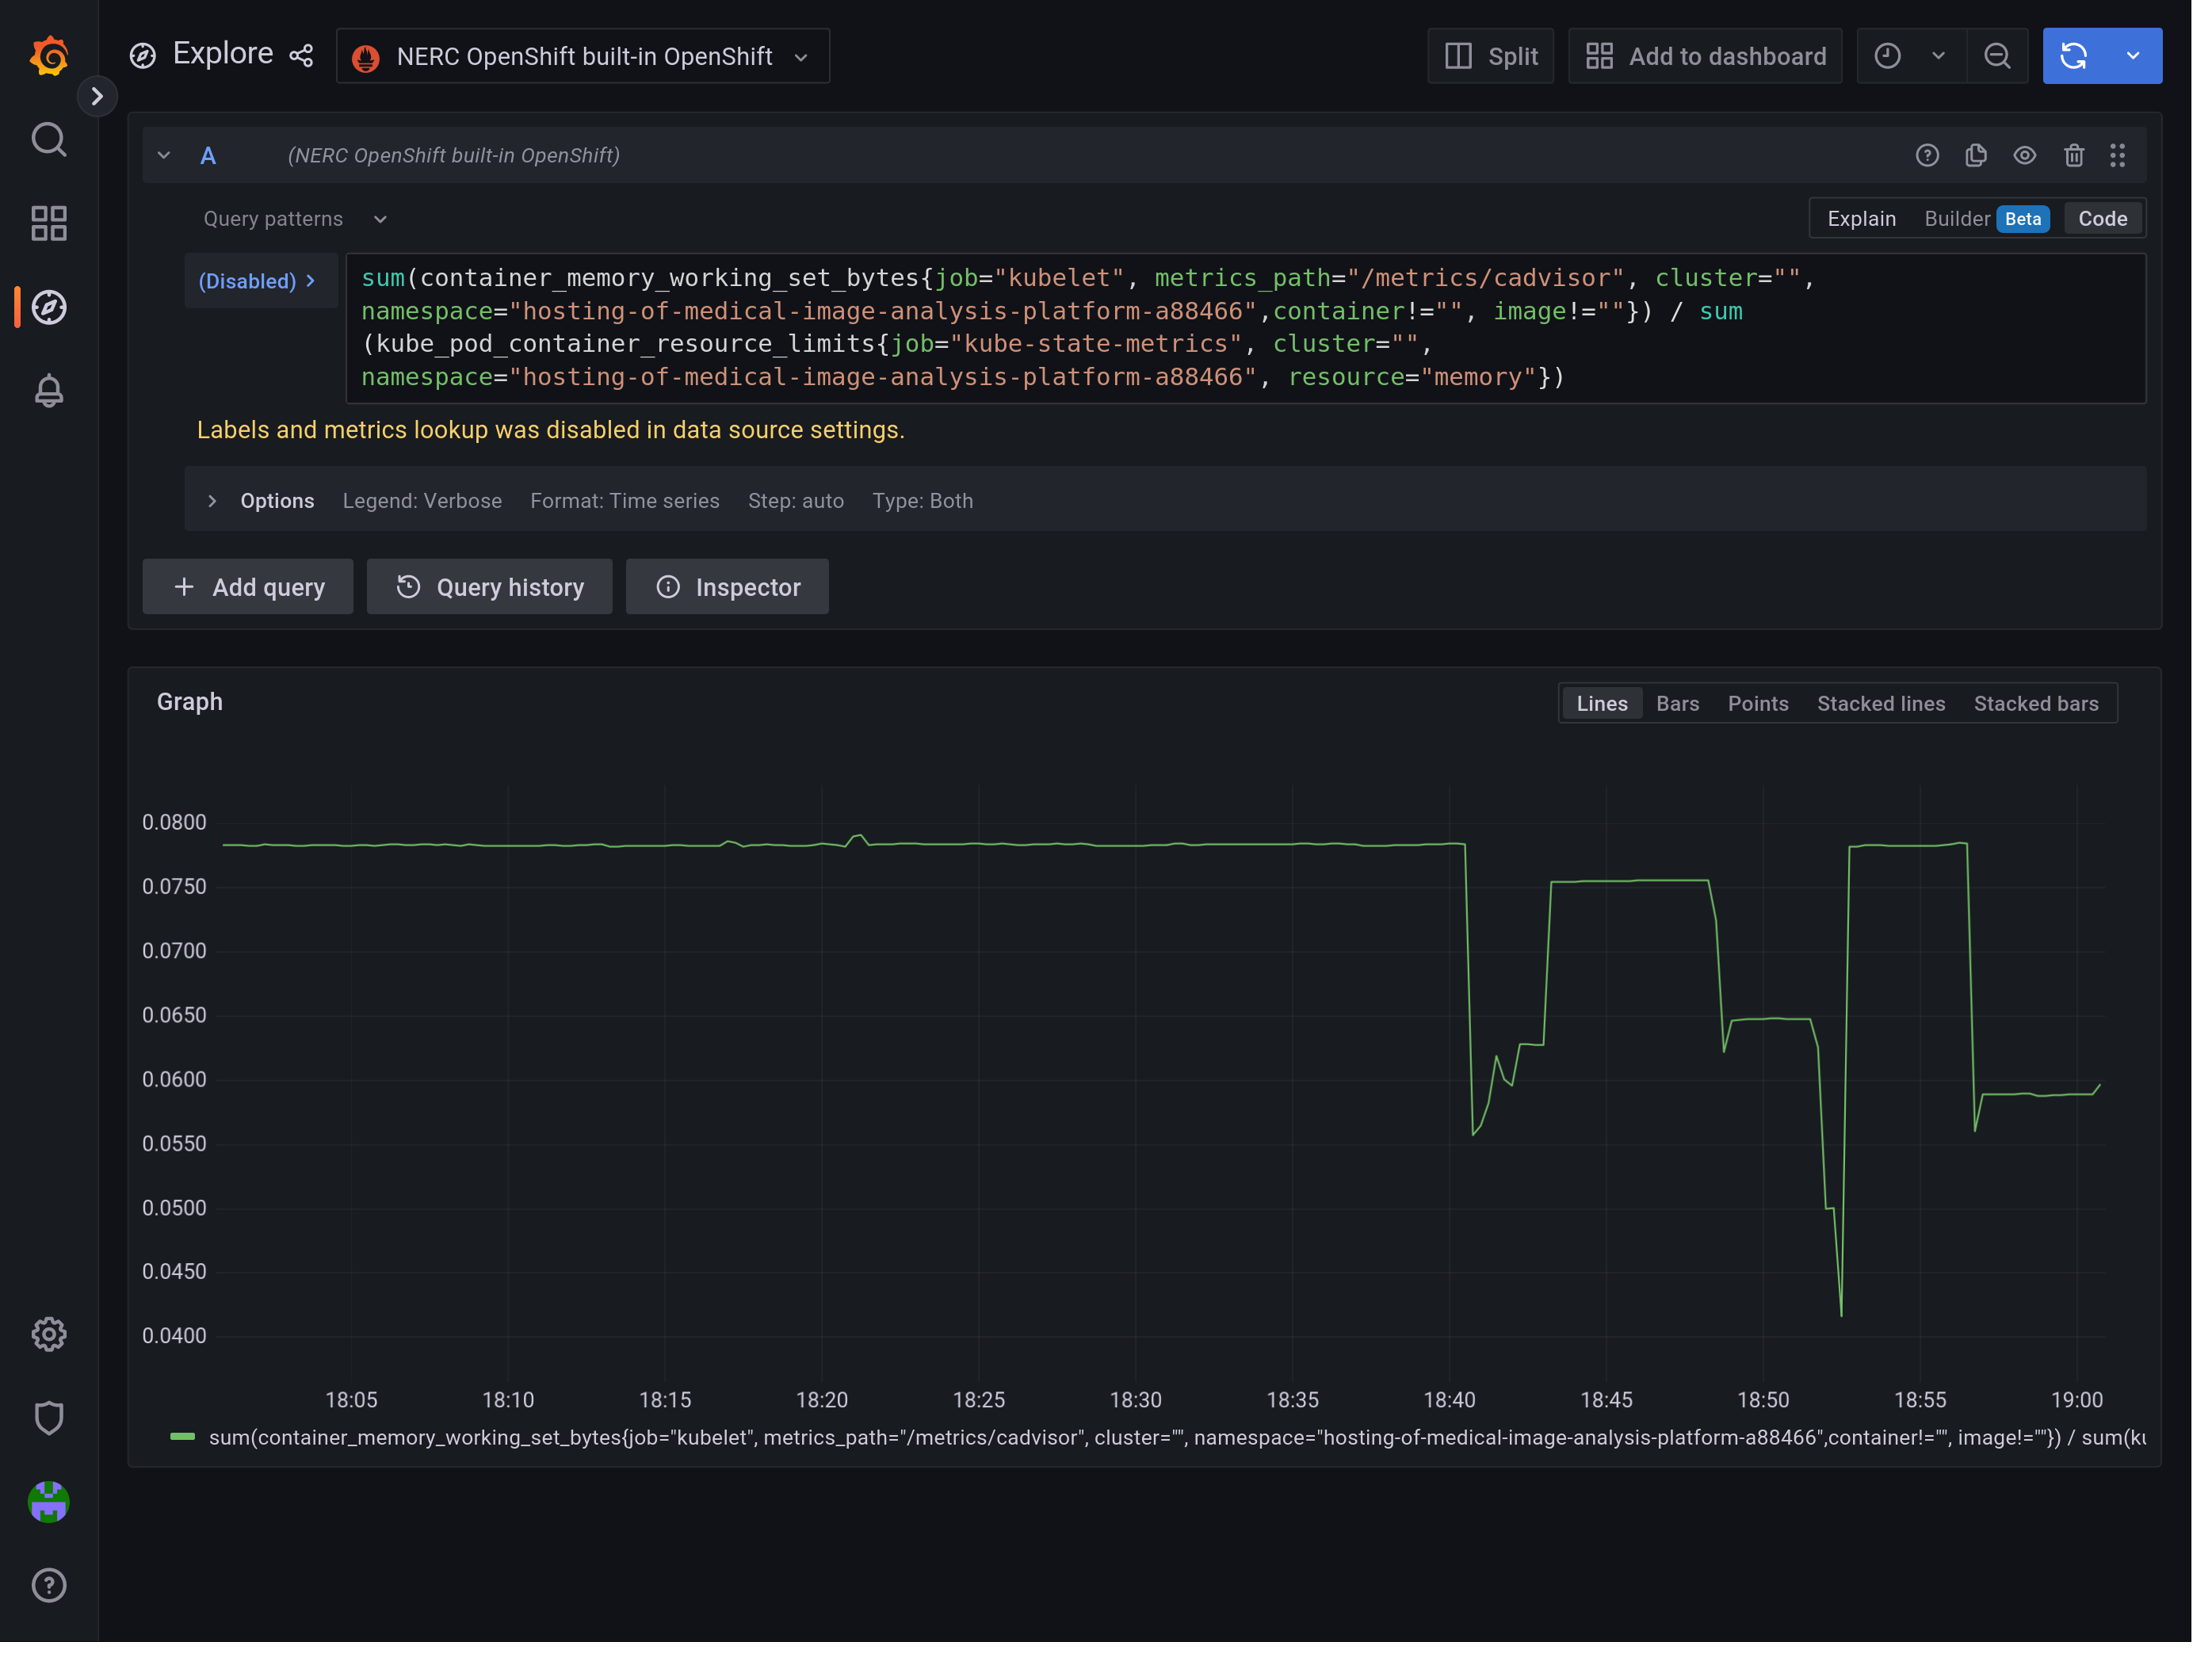
namespace=... - Metrics lookup does not work (see below) so in the "Misc" section I toggled the switch for "Disable metrics lookup".
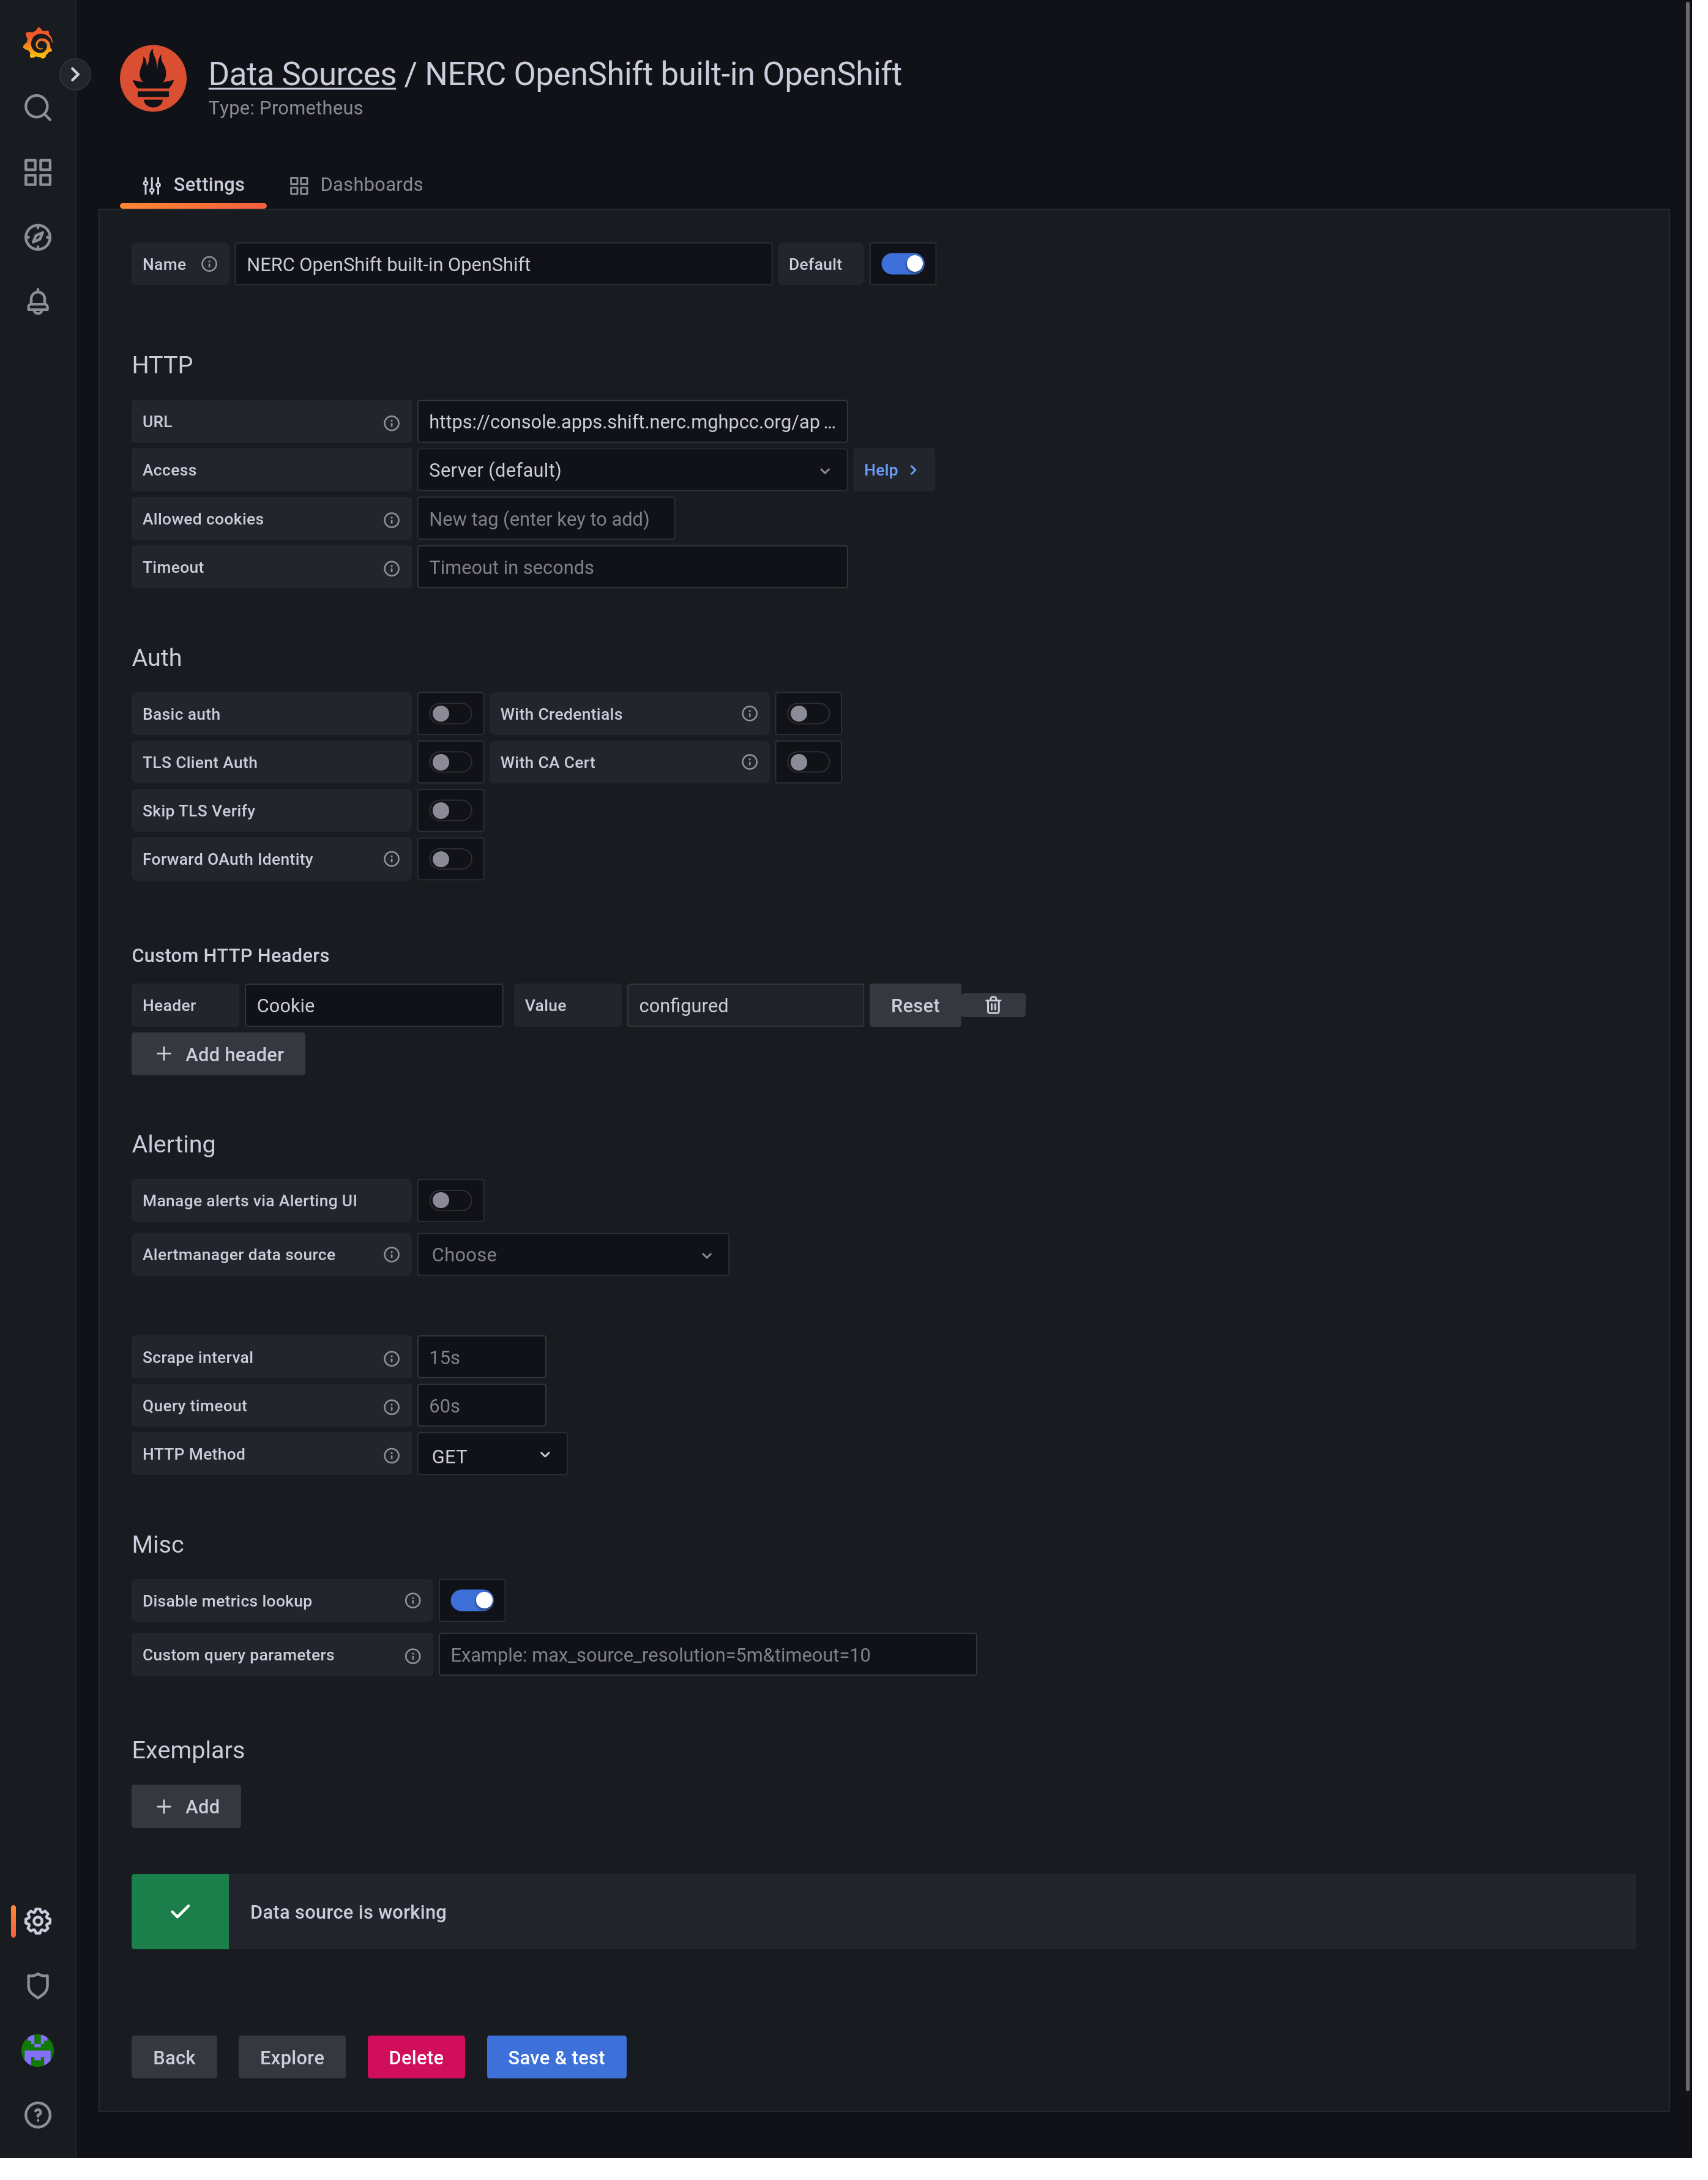
And... It works!
Why Can't Metrics Lookup Work?
The prometheus-tenancy API exposes a subset of Prometheus' API, query, query_range, and rules
(code).
Grafana requires the labels and values API endpoints for the metrics lookup feature.
In OpenShift's Observe UI, there is the option to run a Metrics "Custom query" which has a metrics name autocomplete feature.
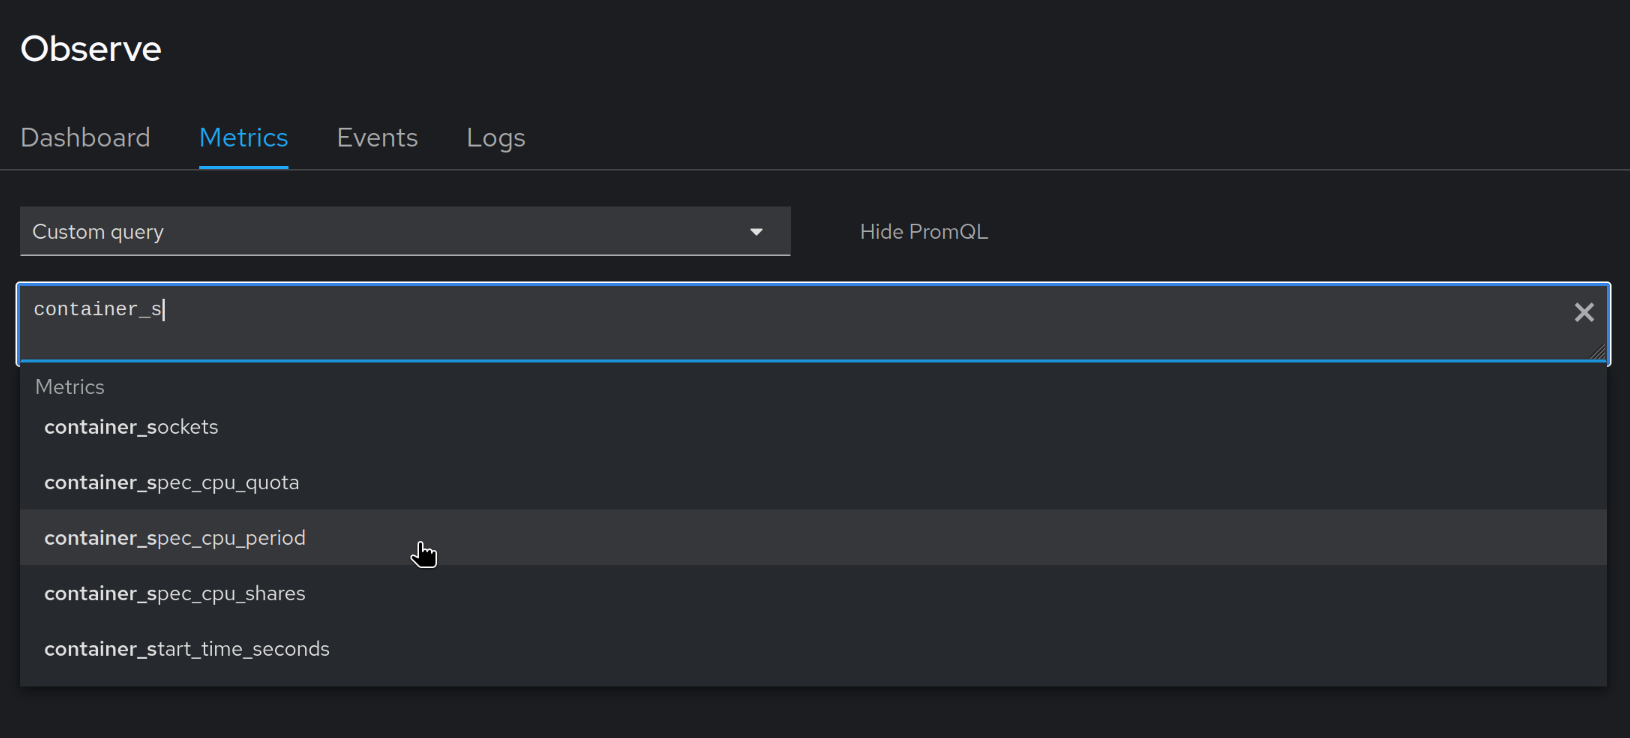
How does it work? Going back to Firefox devtools, I exported all the HTTP requests by clicking "Save all as HAR".
A HAR file is just a JSON document containing all the request data.
I searched the HAR file for the string container_sockets because I knew this string would appear in the response
to the request which fetches the list of metric names to use for the autocomplete feature. It turns out the request
is being made to /prometheus-tenancy/api/v1/query with the PromQL query
count({namespace="hosting-of-medical-image-analysis-platform-a88466"}) by (__name__)
I confirmed that this query is used for the feature by finding the responsible code in the source repository for the OpenShift console (code).
For convenience, I saved the names from the query result to a text file which you can download: openshift_prometheus_tenancy_metric_names.txt